| Param | Original file | Final file |
|---|---|---|
| Filename | modeM0/AS1G05_154T01_9000000576cztM0_level2.evt | modeM0/AS1G05_154T01_9000000576cztM0_level2_quad_clean.evt |
| Size (bytes) | 8,634,859,200 | 1,114,364,160 |
| Size | 8.0 GB | 1.0 GB |
| Events in quadrant A | 48,406,884 | 7,028,244 |
| Events in quadrant B | 54,813,558 | 7,065,122 |
| Events in quadrant C | 48,191,581 | 7,068,295 |
| Events in quadrant D | 103,352,764 | 5,725,184 |
| Mode M9 | |||
|---|---|---|---|
| Quadrant | BADHDUFLAG | Total packets | Discarded packets |
| A | 0 | 123 | 0 |
| B | 0 | 123 | 0 |
| C | 0 | 123 | 0 |
| D | 0 | 124 | 0 |
| Mode M0 | |||
|---|---|---|---|
| Quadrant | BADHDUFLAG | Total packets | Discarded packets |
| A | 0 | 212609 | 0 |
| B | 0 | 228687 | 0 |
| C | 0 | 210857 | 0 |
| D | 0 | 377189 | 0 |
| Mode SS | |||
|---|---|---|---|
| Quadrant | BADHDUFLAG | Total packets | Discarded packets |
| A | 0 | 2034 | 0 |
| B | 0 | 2034 | 0 |
| C | 0 | 2034 | 0 |
| D | 0 | 2030 | 0 |
| Quadrant | Total seconds | Saturated seconds | Saturation percentage |
|---|---|---|---|
| A | 100072 | 2187 | 2.185426% |
| B | 100062 | 3630 | 3.627751% |
| C | 100084 | 1445 | 1.443787% |
| D | 100072 | 23145 | 23.128348% |
Noise dominated data is calculated using 1-second bins in cleaned event files. If a bin has >2000 counts, and if more than 50% of those come from <1% of pixels, then it is considered to be noise-dominated and hence unusable.
| Quadrant | # 1 sec bins | Bins with >0 counts | Bins with >2000 counts | High rate bins dominated by noise | Noise dominated (total time) | Noise dominated (detector-on time) | Marked lightcurve |
|---|---|---|---|---|---|---|---|
| A | 119298 | 100268 | 267 | 267 | 0.22% | 0.27% |  |
| B | 119298 | 100247 | 1327 | 1327 | 1.11% | 1.32% | 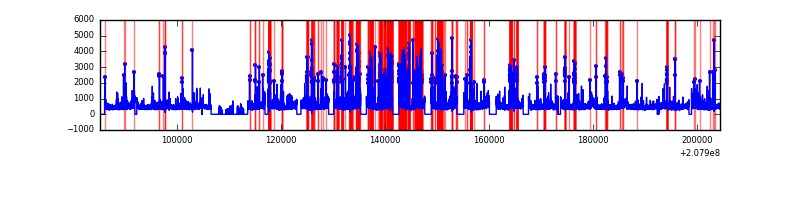 |
| C | 119298 | 100270 | 129 | 129 | 0.11% | 0.13% |  |
| D | 119297 | 100284 | 19505 | 19505 | 16.35% | 19.45% | 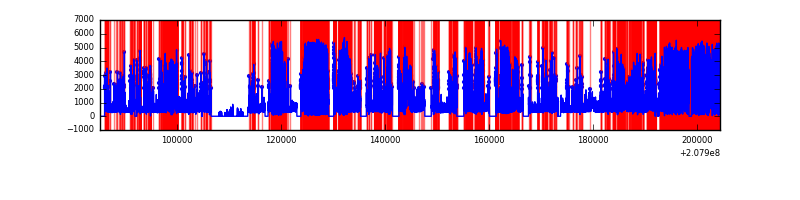 |
Top three noisy pixels from each quadrant. If the there are fewer than three noisy pixels in the level2.evt file, extra rows are filled as -1
| Pixel properties | Quadrant properties | ||||||
|---|---|---|---|---|---|---|---|
| Quadrant | DetID | PixID | Counts | Sigma | Mean | Median | Sigma |
| A | 8 | 15 | 928972 | 383.04 | 11770 | 11530 | 2395.1 |
| A | 0 | 118 | 785797 | 323.27 | 11770 | 11530 | 2395.1 |
| A | 15 | 174 | 656950 | 269.47 | 11770 | 11530 | 2395.1 |
| B | 10 | 16 | 3137485 | 1375.11 | 11889 | 11604 | 2273.2 |
| B | 14 | 167 | 2458589 | 1076.46 | 11889 | 11604 | 2273.2 |
| B | 5 | 200 | 1028923 | 447.53 | 11889 | 11604 | 2273.2 |
| C | 14 | 48 | 2093255 | 780.85 | 11479 | 11521 | 2666.0 |
| C | 8 | 208 | 450179 | 164.54 | 11479 | 11521 | 2666.0 |
| C | 9 | 247 | 357107 | 129.63 | 11479 | 11521 | 2666.0 |
| D | 8 | 112 | 40800260 | 17288.24 | 9769 | 9488 | 2359.5 |
| D | 13 | 235 | 20103112 | 8516.22 | 9769 | 9488 | 2359.5 |
| D | 2 | 234 | 1287589 | 541.69 | 9769 | 9488 | 2359.5 |
Histogram calculated using DETX and DETY for each event in the final _common_clean file
| Quadrant A |  |
 |
Quadrant B |
|---|---|---|---|
| Quadrant D |  |
 |
Quadrant C |
| Plot type | Count rate plots | Images |
|---|---|---|
| Comparison with Poisson distribution Blue bars denote a histogram of data divided into 1 sec bins. Red curve is a Poisson curve with rate = median count rate of data. |
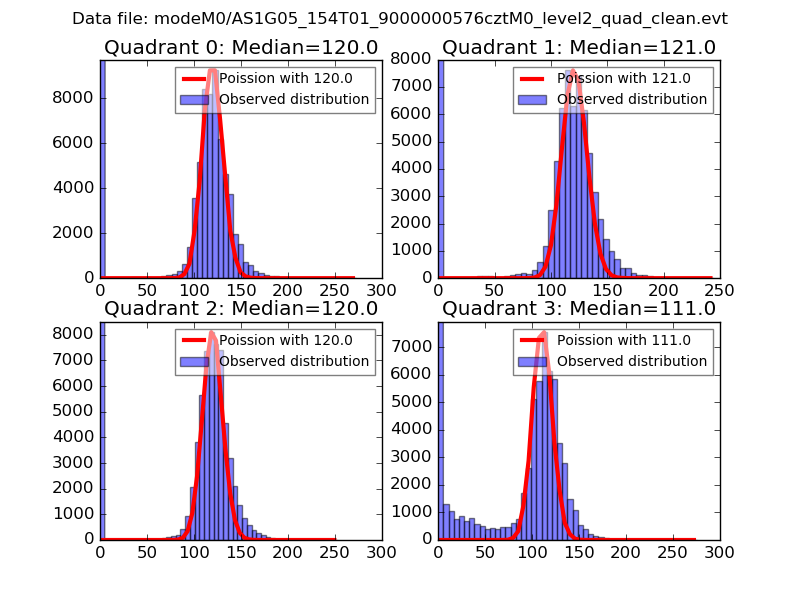 |
 |
| Quadrant-wise count rates Data is divided into 100 sec bins |
 |
|
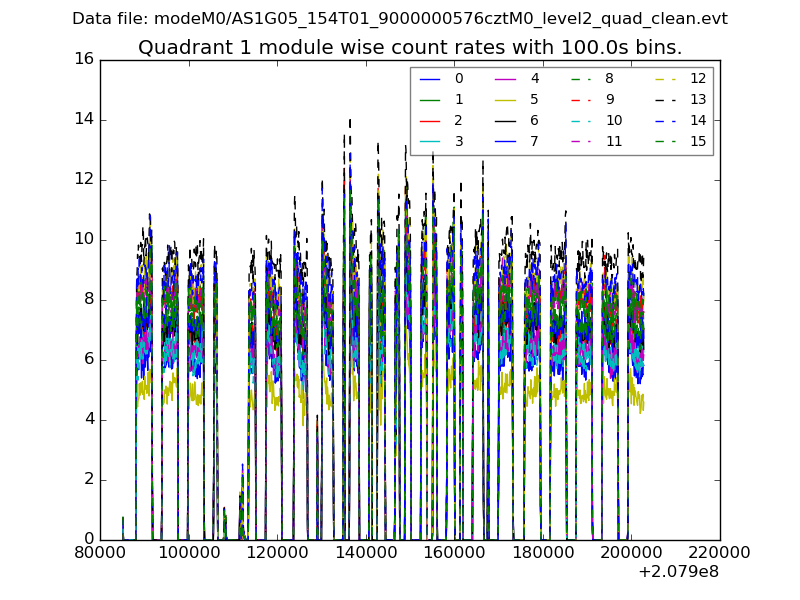
| Module-wise count rates for Quadrant A Data is divided into 100 sec bins |
 |
 |
| Module-wise count rates for Quadrant B Data is divided into 100 sec bins |
 |
 |
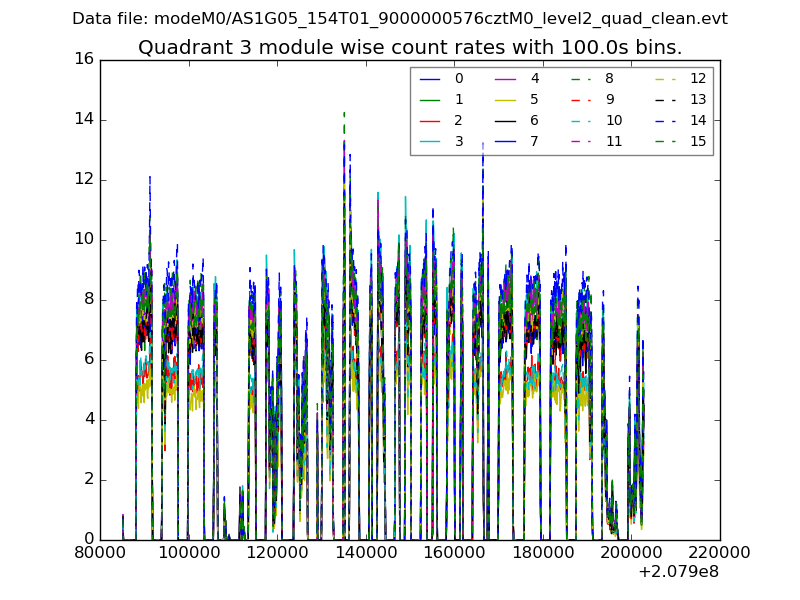
| Module-wise count rates for Quadrant C Data is divided into 100 sec bins |
 |
 |
| Module-wise count rates for Quadrant D Data is divided into 100 sec bins |
 |
 |
| Parameter | Plot |
|---|---|
| CZT HV Monitor |  |
| D_VDD |  |
| Temperature 1 | 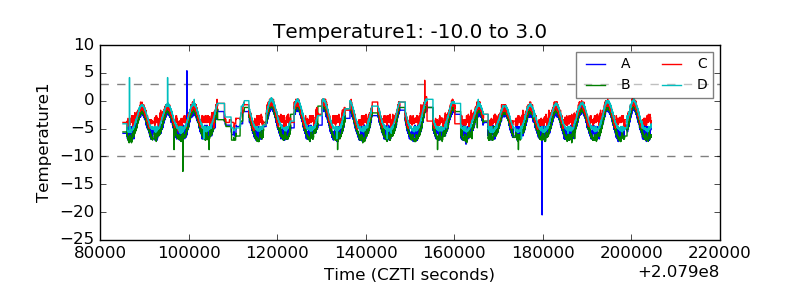 |
| Veto HV Monitor |  |
| Veto LLD |  |
| Alpha Counter |  |
| _CPM_Rate | 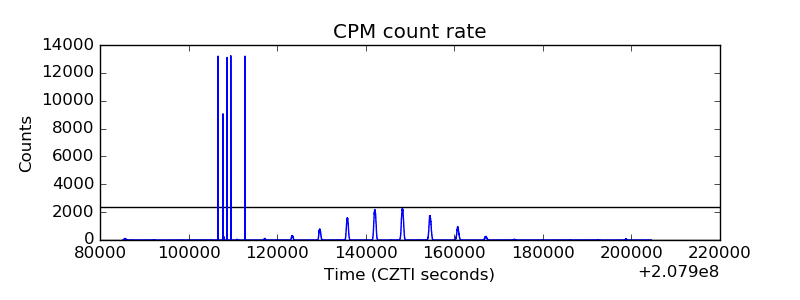 |
| CZT Counter |  |
| +2.5 Volts monitor |  |
| +5 Volts monitor |  |
| _ROLL_ROT |  |
| _Roll_DEC | 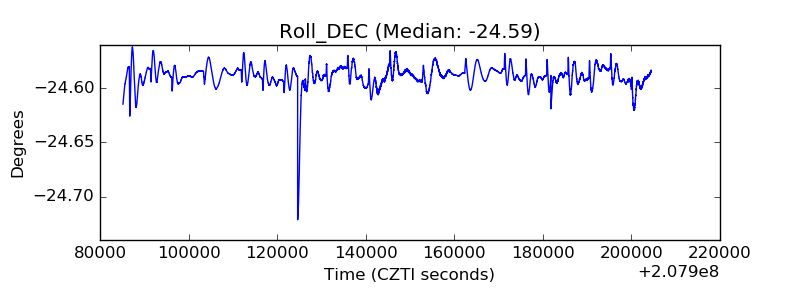 |
| _Roll_RA |  |
| Veto Counter |  |