| Param | Original file | Final file |
|---|---|---|
| Filename | modeM0/AS1G05_191T01_9000000572cztM0_level2.evt | modeM0/AS1G05_191T01_9000000572cztM0_level2_quad_clean.evt |
| Size (bytes) | 4,344,053,760 | 749,174,400 |
| Size | 4.0 GB | 714.5 MB |
| Events in quadrant A | 26,887,159 | 4,956,535 |
| Events in quadrant B | 28,290,233 | 4,974,933 |
| Events in quadrant C | 25,984,025 | 4,891,378 |
| Events in quadrant D | 46,698,943 | 4,102,996 |
| Mode M0 | |||
|---|---|---|---|
| Quadrant | BADHDUFLAG | Total packets | Discarded packets |
| A | 0 | 115571 | 0 |
| B | 0 | 119698 | 0 |
| C | 0 | 115170 | 0 |
| D | 0 | 176666 | 0 |
| Mode SS | |||
|---|---|---|---|
| Quadrant | BADHDUFLAG | Total packets | Discarded packets |
| A | 0 | 1112 | 0 |
| B | 0 | 1114 | 0 |
| C | 0 | 1114 | 0 |
| D | 0 | 1114 | 0 |
| Mode M9 | |||
|---|---|---|---|
| Quadrant | BADHDUFLAG | Total packets | Discarded packets |
| A | 0 | 69 | 0 |
| B | 0 | 69 | 0 |
| C | 0 | 69 | 0 |
| D | 0 | 69 | 0 |
| Quadrant | Total seconds | Saturated seconds | Saturation percentage |
|---|---|---|---|
| A | 54879 | 953 | 1.736548% |
| B | 54877 | 1139 | 2.075551% |
| C | 54902 | 620 | 1.129285% |
| D | 54806 | 8621 | 15.730030% |
Noise dominated data is calculated using 1-second bins in cleaned event files. If a bin has >2000 counts, and if more than 50% of those come from <1% of pixels, then it is considered to be noise-dominated and hence unusable.
| Quadrant | # 1 sec bins | Bins with >0 counts | Bins with >2000 counts | High rate bins dominated by noise | Noise dominated (total time) | Noise dominated (detector-on time) | Marked lightcurve |
|---|---|---|---|---|---|---|---|
| A | 61753 | 54984 | 85 | 85 | 0.14% | 0.15% |  |
| B | 61753 | 54991 | 195 | 195 | 0.32% | 0.35% |  |
| C | 61753 | 54990 | 16 | 16 | 0.03% | 0.03% |  |
| D | 61753 | 54901 | 7216 | 7216 | 11.69% | 13.14% |  |
Top three noisy pixels from each quadrant. If the there are fewer than three noisy pixels in the level2.evt file, extra rows are filled as -1
| Pixel properties | Quadrant properties | ||||||
|---|---|---|---|---|---|---|---|
| Quadrant | DetID | PixID | Counts | Sigma | Mean | Median | Sigma |
| A | 15 | 174 | 590465 | 436.57 | 6626 | 6501 | 1337.6 |
| A | 13 | 14 | 385805 | 283.57 | 6626 | 6501 | 1337.6 |
| A | 8 | 15 | 175860 | 126.61 | 6626 | 6501 | 1337.6 |
| B | 2 | 249 | 692999 | 541.32 | 6678 | 6537 | 1268.1 |
| B | 10 | 16 | 582257 | 453.99 | 6678 | 6537 | 1268.1 |
| B | 14 | 167 | 353151 | 273.33 | 6678 | 6537 | 1268.1 |
| C | 14 | 48 | 619477 | 411.77 | 6439 | 6495 | 1488.6 |
| C | 9 | 247 | 70304 | 42.86 | 6439 | 6495 | 1488.6 |
| C | 9 | 54 | 53308 | 31.45 | 6439 | 6495 | 1488.6 |
| D | 13 | 235 | 21203218 | 14948.57 | 5857 | 5693 | 1418.0 |
| D | 10 | 15 | 1107924 | 777.3 | 5857 | 5693 | 1418.0 |
| D | 13 | 239 | 463954 | 323.17 | 5857 | 5693 | 1418.0 |
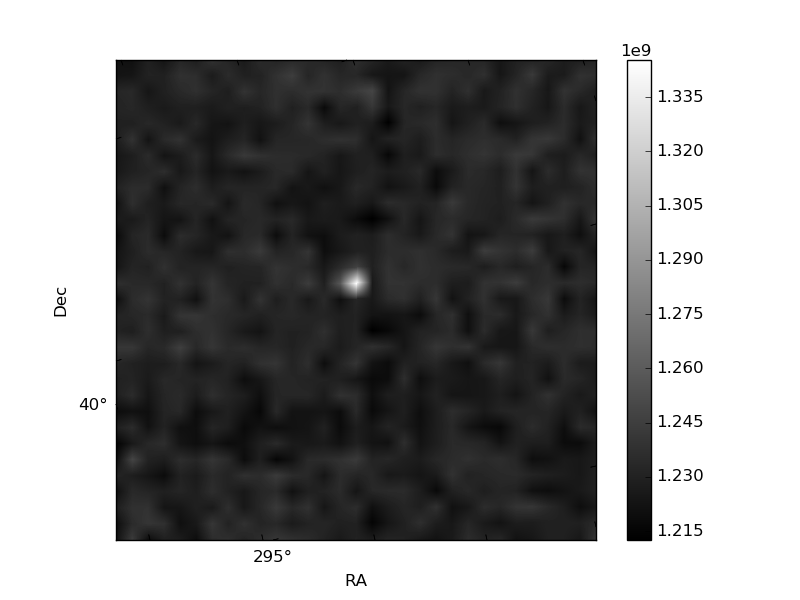
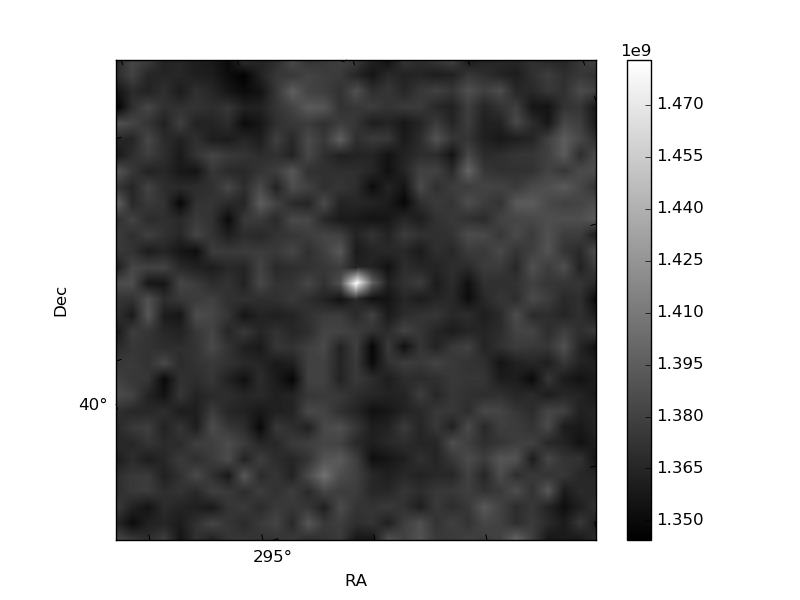
Histogram calculated using DETX and DETY for each event in the final _common_clean file
| Quadrant A |  |
 |
Quadrant B |
|---|---|---|---|
| Quadrant D |  |
 |
Quadrant C |
| Plot type | Count rate plots | Images |
|---|---|---|
| Comparison with Poisson distribution Blue bars denote a histogram of data divided into 1 sec bins. Red curve is a Poisson curve with rate = median count rate of data. |
 |
 |
| Quadrant-wise count rates Data is divided into 100 sec bins |
 |
|
| Module-wise count rates for Quadrant A Data is divided into 100 sec bins |
 |
 |
| Module-wise count rates for Quadrant B Data is divided into 100 sec bins |
 |
 |
| Module-wise count rates for Quadrant C Data is divided into 100 sec bins |
 |
 |
| Module-wise count rates for Quadrant D Data is divided into 100 sec bins |
 |
 |
| Parameter | Plot |
|---|---|
| CZT HV Monitor |  |
| D_VDD |  |
| Temperature 1 |  |
| Veto HV Monitor |  |
| Veto LLD |  |
| Alpha Counter |  |
| _CPM_Rate |  |
| CZT Counter |  |
| +2.5 Volts monitor |  |
| +5 Volts monitor |  |
| _ROLL_ROT |  |
| _Roll_DEC |  |
| _Roll_RA | 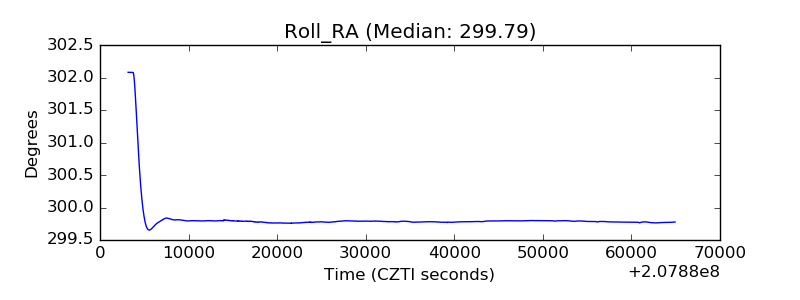 |
| Veto Counter |  |