| Param | Original file | Final file |
|---|---|---|
| Filename | modeM0/AS1G05_167T02_9000000574cztM0_level2_bc.evt | modeM0/AS1G05_167T02_9000000574cztM0_level2_quad_clean.evt |
| Size (bytes) | 1,150,560,000 | 302,613,120 |
| Size | 1.1 GB | 288.6 MB |
| Events in quadrant A | 6,454,562 | 1,761,447 |
| Events in quadrant B | 7,080,902 | 1,797,288 |
| Events in quadrant C | 11,003,914 | 1,776,057 |
| Events in quadrant D | 8,151,525 | 1,661,243 |
| Mode M0 | |||
|---|---|---|---|
| Quadrant | BADHDUFLAG | Total packets | Discarded packets |
| A | 0 | 65683 | 0 |
| B | 0 | 66910 | 0 |
| C | 0 | 78590 | 0 |
| D | 0 | 72881 | 0 |
| Mode SS | |||
|---|---|---|---|
| Quadrant | BADHDUFLAG | Total packets | Discarded packets |
| A | 0 | 640 | 0 |
| B | 0 | 640 | 0 |
| C | 0 | 640 | 0 |
| D | 0 | 640 | 0 |
| Mode M9 | |||
|---|---|---|---|
| Quadrant | BADHDUFLAG | Total packets | Discarded packets |
| A | 0 | 75 | 0 |
| B | 0 | 75 | 0 |
| C | 0 | 75 | 0 |
| D | 0 | 75 | 0 |
| Quadrant | Total seconds | Saturated seconds | Saturation percentage |
|---|---|---|---|
| A | 31569 | 203 | 0.643036% |
| B | 31569 | 253 | 0.801419% |
| C | 31569 | 163 | 0.516329% |
| D | 31569 | 630 | 1.995629% |
Noise dominated data is calculated using 1-second bins in cleaned event files. If a bin has >2000 counts, and if more than 50% of those come from <1% of pixels, then it is considered to be noise-dominated and hence unusable.
| Quadrant | # 1 sec bins | Bins with >0 counts | Bins with >2000 counts | High rate bins dominated by noise | Noise dominated (total time) | Noise dominated (detector-on time) | Marked lightcurve |
|---|---|---|---|---|---|---|---|
| A | 38929 | 31570 | 0 | 0 | 0.00% | 0.00% |  |
| B | 38929 | 31570 | 10 | 10 | 0.03% | 0.03% |  |
| C | 38929 | 31569 | 2 | 2 | 0.01% | 0.01% |  |
| D | 38929 | 31569 | 40 | 40 | 0.10% | 0.13% |  |
Top three noisy pixels from each quadrant. If the there are fewer than three noisy pixels in the level2.evt file, extra rows are filled as -1
| Pixel properties | Quadrant properties | ||||||
|---|---|---|---|---|---|---|---|
| Quadrant | DetID | PixID | Counts | Sigma | Mean | Median | Sigma |
| A | 15 | 174 | 126225 | 354.94 | 1593 | 1558 | 351.2 |
| A | 10 | 253 | 71577 | 199.35 | 1593 | 1558 | 351.2 |
| A | 0 | 50 | 65074 | 180.84 | 1593 | 1558 | 351.2 |
| B | 14 | 167 | 185197 | 597.52 | 1625 | 1580 | 307.3 |
| B | 15 | 204 | 165967 | 534.94 | 1625 | 1580 | 307.3 |
| B | 4 | 48 | 148432 | 477.88 | 1625 | 1580 | 307.3 |
| C | 14 | 48 | 4725655 | 13204.49 | 1580 | 1550 | 357.8 |
| C | 9 | 247 | 52062 | 141.19 | 1580 | 1550 | 357.8 |
| C | 12 | 4 | 20741 | 53.64 | 1580 | 1550 | 357.8 |
| D | 13 | 235 | 1241417 | 3416.54 | 1558 | 1497 | 362.9 |
| D | 2 | 136 | 338657 | 929.03 | 1558 | 1497 | 362.9 |
| D | 2 | 14 | 107291 | 291.51 | 1558 | 1497 | 362.9 |
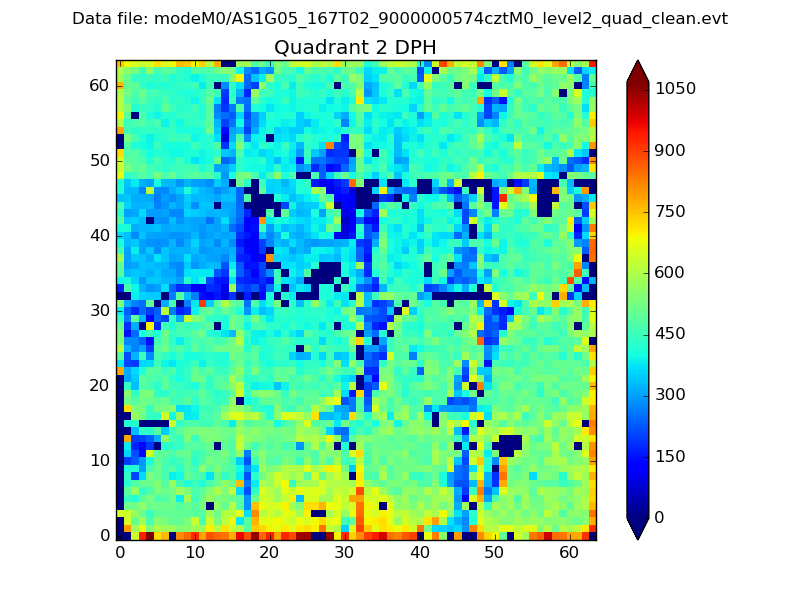
Histogram calculated using DETX and DETY for each event in the final _common_clean file
| Quadrant A |  |
 |
Quadrant B |
|---|---|---|---|
| Quadrant D | 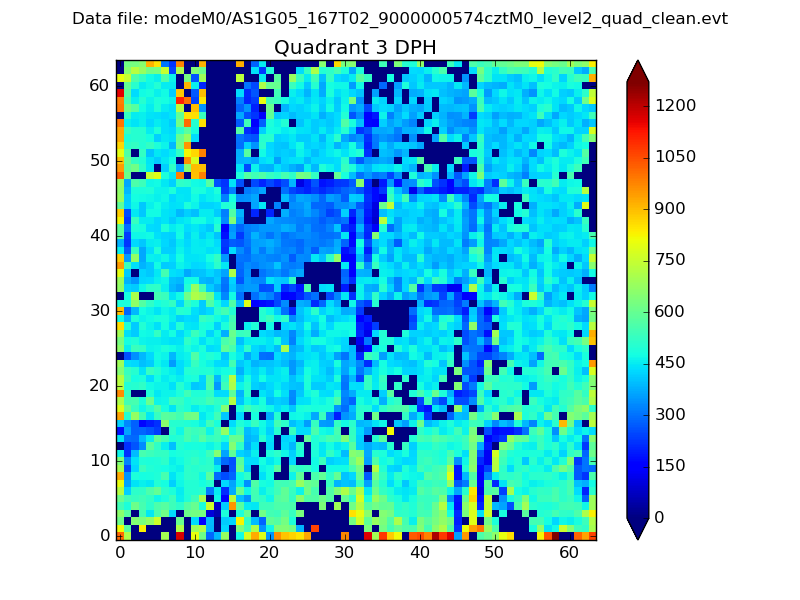 |
 |
Quadrant C |
| Plot type | Count rate plots | Images |
|---|---|---|
| Comparison with Poisson distribution Blue bars denote a histogram of data divided into 1 sec bins. Red curve is a Poisson curve with rate = median count rate of data. |
 |
 |
| Quadrant-wise count rates Data is divided into 100 sec bins |
 |
|
| Module-wise count rates for Quadrant A Data is divided into 100 sec bins |
 |
 |
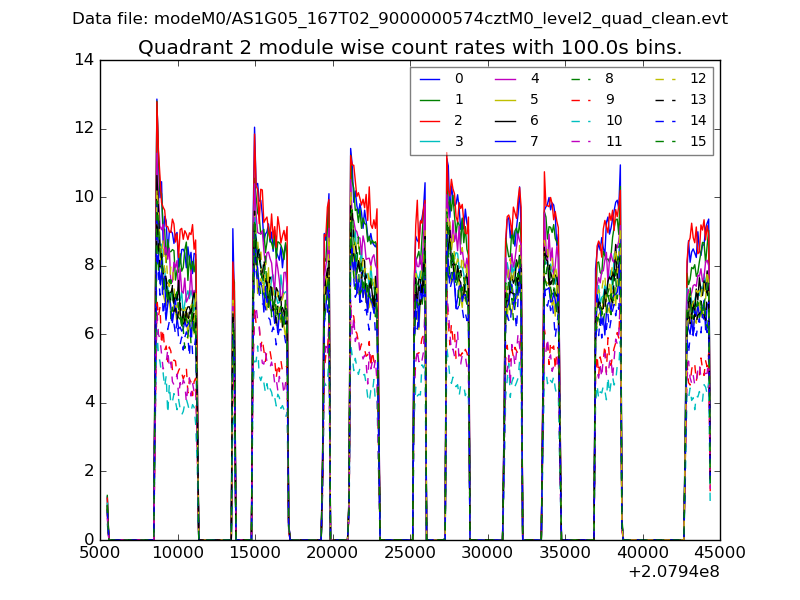
| Module-wise count rates for Quadrant B Data is divided into 100 sec bins |
 |
 |
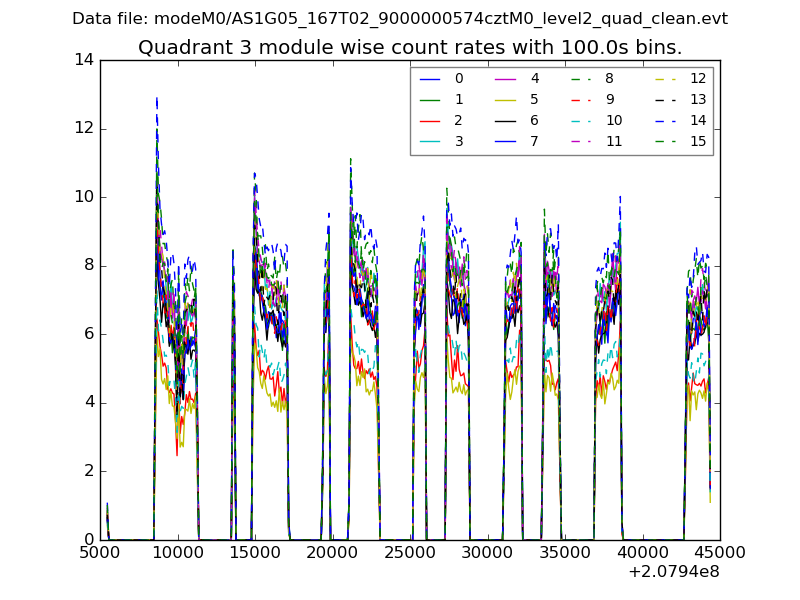
| Module-wise count rates for Quadrant C Data is divided into 100 sec bins |
 |
 |
| Module-wise count rates for Quadrant D Data is divided into 100 sec bins |
 |
 |
| Parameter | Plot |
|---|---|
| CZT HV Monitor |  |
| D_VDD | 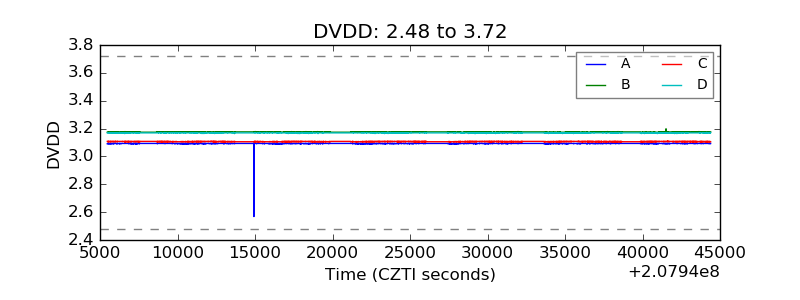 |
| Temperature 1 |  |
| Veto HV Monitor | 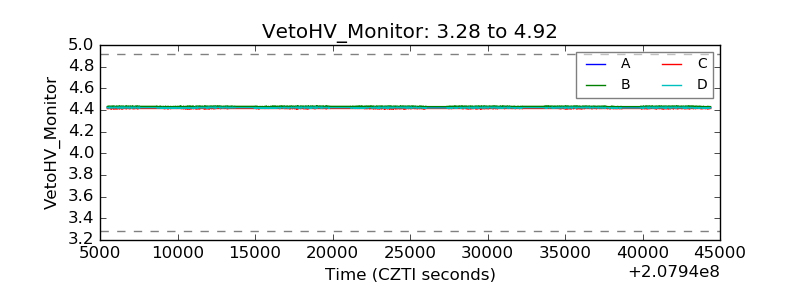 |
| Veto LLD |  |
| Alpha Counter |  |
| _CPM_Rate |  |
| CZT Counter |  |
| +2.5 Volts monitor |  |
| +5 Volts monitor |  |
| _ROLL_ROT |  |
| _Roll_DEC |  |
| _Roll_RA |  |
| Veto Counter |  |