| Param | Original file | Final file |
|---|---|---|
| Filename | modeM0/AS1G05_250T01_9000000568cztM0_level2.evt | modeM0/AS1G05_250T01_9000000568cztM0_level2_quad_clean.evt |
| Size (bytes) | 12,034,762,560 | 2,057,431,680 |
| Size | 11.2 GB | 1.9 GB |
| Events in quadrant A | 121,011,761 | 12,484,452 |
| Events in quadrant B | 75,584,219 | 13,335,794 |
| Events in quadrant C | 72,739,531 | 13,091,829 |
| Events in quadrant D | 84,536,108 | 12,627,990 |
| Mode M0 | |||
|---|---|---|---|
| Quadrant | BADHDUFLAG | Total packets | Discarded packets |
| A | 0 | 467438 | 0 |
| B | 0 | 333380 | 0 |
| C | 0 | 331627 | 0 |
| D | 0 | 364910 | 0 |
| Mode SS | |||
|---|---|---|---|
| Quadrant | BADHDUFLAG | Total packets | Discarded packets |
| A | 0 | 3216 | 0 |
| B | 0 | 3218 | 0 |
| C | 0 | 3228 | 0 |
| D | 0 | 3230 | 0 |
| Mode M9 | |||
|---|---|---|---|
| Quadrant | BADHDUFLAG | Total packets | Discarded packets |
| A | 0 | 247 | 0 |
| B | 0 | 244 | 0 |
| C | 0 | 246 | 0 |
| D | 0 | 248 | 0 |
| Quadrant | Total seconds | Saturated seconds | Saturation percentage |
|---|---|---|---|
| A | 156802 | 17592 | 11.219245% |
| B | 157423 | 2541 | 1.614122% |
| C | 157437 | 2141 | 1.359909% |
| D | 157079 | 3567 | 2.270832% |
Noise dominated data is calculated using 1-second bins in cleaned event files. If a bin has >2000 counts, and if more than 50% of those come from <1% of pixels, then it is considered to be noise-dominated and hence unusable.
| Quadrant | # 1 sec bins | Bins with >0 counts | Bins with >2000 counts | High rate bins dominated by noise | Noise dominated (total time) | Noise dominated (detector-on time) | Marked lightcurve |
|---|---|---|---|---|---|---|---|
| A | 202083 | 157984 | 9628 | 9628 | 4.76% | 6.09% |  |
| B | 202083 | 158710 | 395 | 395 | 0.20% | 0.25% |  |
| C | 202083 | 158683 | 381 | 381 | 0.19% | 0.24% |  |
| D | 202083 | 158421 | 1711 | 1711 | 0.85% | 1.08% |  |
Top three noisy pixels from each quadrant. If the there are fewer than three noisy pixels in the level2.evt file, extra rows are filled as -1
| Pixel properties | Quadrant properties | ||||||
|---|---|---|---|---|---|---|---|
| Quadrant | DetID | PixID | Counts | Sigma | Mean | Median | Sigma |
| A | 0 | 13 | 48635505 | 14205.44 | 17065 | 16715 | 3422.5 |
| A | 13 | 251 | 2704047 | 785.18 | 17065 | 16715 | 3422.5 |
| A | 0 | 50 | 1382548 | 399.07 | 17065 | 16715 | 3422.5 |
| B | 4 | 80 | 1283841 | 370.13 | 18143 | 17692 | 3420.8 |
| B | 15 | 204 | 990523 | 284.39 | 18143 | 17692 | 3420.8 |
| B | 4 | 48 | 948499 | 272.1 | 18143 | 17692 | 3420.8 |
| C | 14 | 48 | 2340471 | 581.08 | 17440 | 17509 | 3997.7 |
| C | 9 | 247 | 1476533 | 364.97 | 17440 | 17509 | 3997.7 |
| C | 1 | 16 | 261291 | 60.98 | 17440 | 17509 | 3997.7 |
| D | 13 | 235 | 5224578 | 1172.37 | 17106 | 16722 | 4442.2 |
| D | 1 | 20 | 4114709 | 922.52 | 17106 | 16722 | 4442.2 |
| D | 13 | 53 | 1462753 | 325.52 | 17106 | 16722 | 4442.2 |
Histogram calculated using DETX and DETY for each event in the final _common_clean file
| Quadrant A |  |
 |
Quadrant B |
|---|---|---|---|
| Quadrant D |  |
 |
Quadrant C |
| Plot type | Count rate plots | Images |
|---|---|---|
| Comparison with Poisson distribution Blue bars denote a histogram of data divided into 1 sec bins. Red curve is a Poisson curve with rate = median count rate of data. |
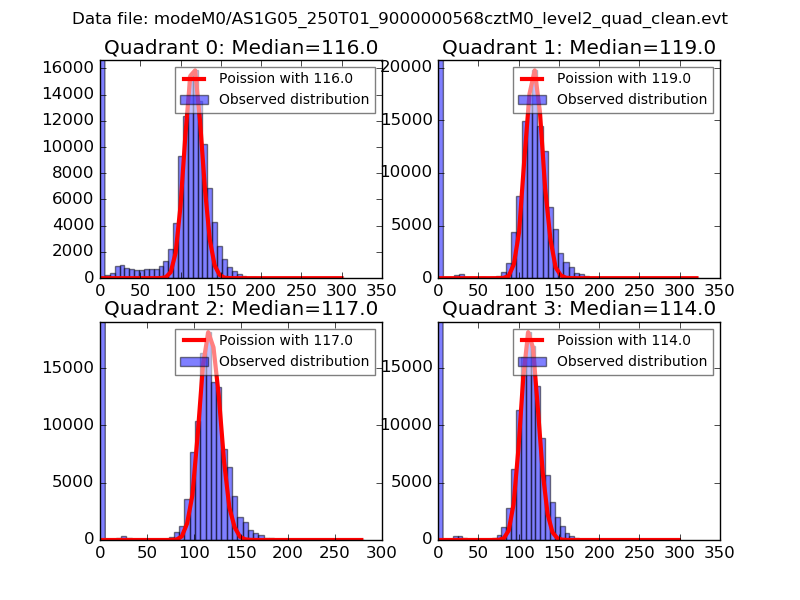 |
 |
| Quadrant-wise count rates Data is divided into 100 sec bins |
 |
|
| Module-wise count rates for Quadrant A Data is divided into 100 sec bins |
 |
 |
| Module-wise count rates for Quadrant B Data is divided into 100 sec bins |
 |
 |
| Module-wise count rates for Quadrant C Data is divided into 100 sec bins |
 |
 |
| Module-wise count rates for Quadrant D Data is divided into 100 sec bins |
 |
 |
| Parameter | Plot |
|---|---|
| CZT HV Monitor |  |
| D_VDD |  |
| Temperature 1 |  |
| Veto HV Monitor | 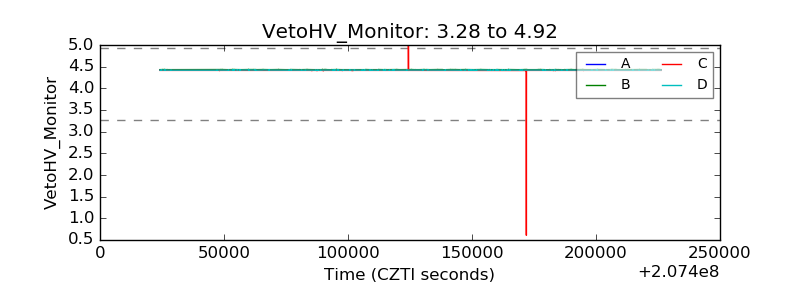 |
| Veto LLD | 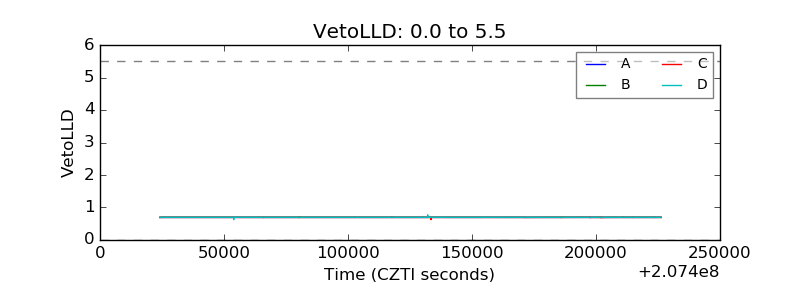 |
| Alpha Counter |  |
| _CPM_Rate |  |
| CZT Counter |  |
| +2.5 Volts monitor |  |
| +5 Volts monitor |  |
| _ROLL_ROT |  |
| _Roll_DEC |  |
| _Roll_RA |  |
| Veto Counter |  |