| Param | Original file | Final file |
|---|---|---|
| Filename | modeM0/AS1G05_083T03_9000000566cztM0_level2_bc.evt | modeM0/AS1G05_083T03_9000000566cztM0_level2_quad_clean.evt |
| Size (bytes) | 2,022,796,800 | 609,891,840 |
| Size | 1.9 GB | 581.6 MB |
| Events in quadrant A | 14,159,645 | 3,844,620 |
| Events in quadrant B | 16,085,169 | 3,819,803 |
| Events in quadrant C | 11,205,574 | 3,873,071 |
| Events in quadrant D | 16,585,937 | 3,687,727 |
| Mode SS | |||
|---|---|---|---|
| Quadrant | BADHDUFLAG | Total packets | Discarded packets |
| A | 0 | 964 | 0 |
| B | 0 | 964 | 0 |
| C | 0 | 964 | 0 |
| D | 0 | 964 | 0 |
| Mode M0 | |||
|---|---|---|---|
| Quadrant | BADHDUFLAG | Total packets | Discarded packets |
| A | 0 | 113877 | 0 |
| B | 0 | 123250 | 0 |
| C | 0 | 103904 | 0 |
| D | 0 | 123628 | 0 |
| Mode M9 | |||
|---|---|---|---|
| Quadrant | BADHDUFLAG | Total packets | Discarded packets |
| A | 0 | 77 | 0 |
| B | 0 | 77 | 0 |
| C | 0 | 77 | 0 |
| D | 0 | 77 | 0 |
| Quadrant | Total seconds | Saturated seconds | Saturation percentage |
|---|---|---|---|
| A | 47320 | 2056 | 4.344886% |
| B | 47318 | 2600 | 5.494738% |
| C | 47320 | 856 | 1.808960% |
| D | 47320 | 2283 | 4.824598% |
Noise dominated data is calculated using 1-second bins in cleaned event files. If a bin has >2000 counts, and if more than 50% of those come from <1% of pixels, then it is considered to be noise-dominated and hence unusable.
| Quadrant | # 1 sec bins | Bins with >0 counts | Bins with >2000 counts | High rate bins dominated by noise | Noise dominated (total time) | Noise dominated (detector-on time) | Marked lightcurve |
|---|---|---|---|---|---|---|---|
| A | 60885 | 47322 | 317 | 317 | 0.52% | 0.67% |  |
| B | 60885 | 47322 | 132 | 132 | 0.22% | 0.28% |  |
| C | 60885 | 47322 | 125 | 125 | 0.21% | 0.26% |  |
| D | 60885 | 47323 | 245 | 245 | 0.40% | 0.52% |  |
Top three noisy pixels from each quadrant. If the there are fewer than three noisy pixels in the level2.evt file, extra rows are filled as -1
| Pixel properties | Quadrant properties | ||||||
|---|---|---|---|---|---|---|---|
| Quadrant | DetID | PixID | Counts | Sigma | Mean | Median | Sigma |
| A | 0 | 31 | 1879777 | 3633.21 | 2340 | 2290 | 516.8 |
| A | 0 | 13 | 1317276 | 2544.69 | 2340 | 2290 | 516.8 |
| A | 0 | 118 | 1037390 | 2003.07 | 2340 | 2290 | 516.8 |
| B | 10 | 16 | 5021621 | 11200.9 | 2335 | 2268 | 448.1 |
| B | 15 | 204 | 867807 | 1931.49 | 2335 | 2268 | 448.1 |
| B | 8 | 3 | 254239 | 562.28 | 2335 | 2268 | 448.1 |
| C | 9 | 247 | 1224360 | 2370.59 | 2318 | 2283 | 515.5 |
| C | 9 | 54 | 732319 | 1416.13 | 2318 | 2283 | 515.5 |
| C | 14 | 48 | 88680 | 167.59 | 2318 | 2283 | 515.5 |
| D | 14 | 34 | 3203402 | 5914.36 | 2308 | 2217 | 541.3 |
| D | 10 | 40 | 1233295 | 2274.48 | 2308 | 2217 | 541.3 |
| D | 13 | 235 | 903899 | 1665.9 | 2308 | 2217 | 541.3 |
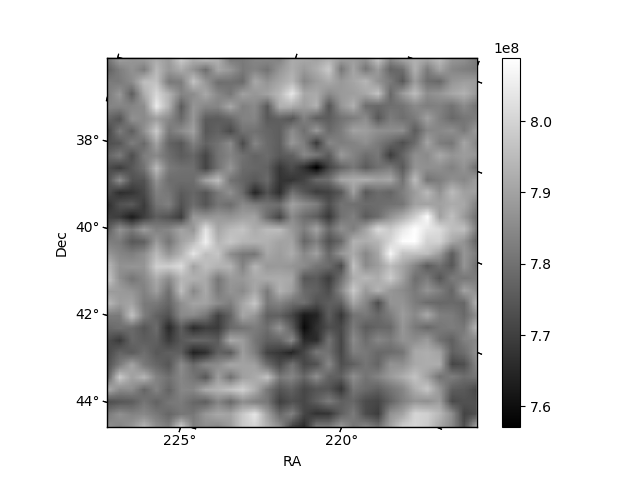
Histogram calculated using DETX and DETY for each event in the final _common_clean file
| Quadrant A |  |
 |
Quadrant B |
|---|---|---|---|
| Quadrant D |  |
 |
Quadrant C |
| Plot type | Count rate plots | Images |
|---|---|---|
| Comparison with Poisson distribution Blue bars denote a histogram of data divided into 1 sec bins. Red curve is a Poisson curve with rate = median count rate of data. |
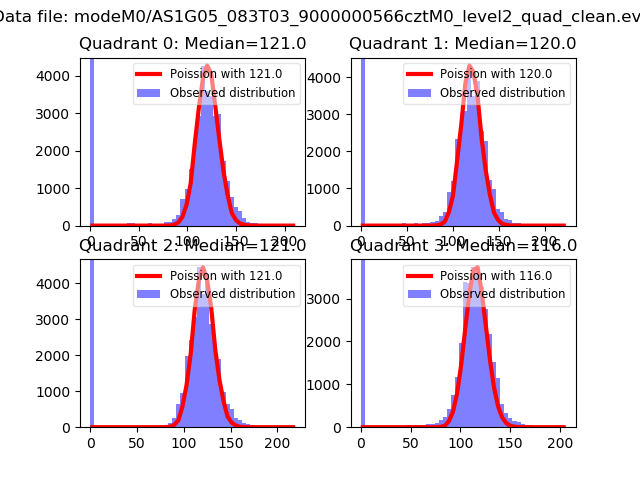 |
 |
| Quadrant-wise count rates Data is divided into 100 sec bins |
 |
|
| Module-wise count rates for Quadrant A Data is divided into 100 sec bins |
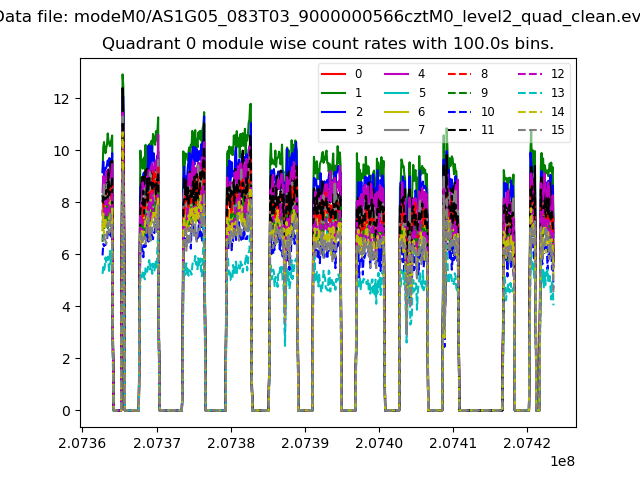 |
 |
| Module-wise count rates for Quadrant B Data is divided into 100 sec bins |
 |
 |
| Module-wise count rates for Quadrant C Data is divided into 100 sec bins |
 |
 |
| Module-wise count rates for Quadrant D Data is divided into 100 sec bins |
 |
 |
| Parameter | Plot |
|---|---|
| CZT HV Monitor |  |
| D_VDD |  |
| Temperature 1 |  |
| Veto HV Monitor |  |
| Veto LLD |  |
| Alpha Counter |  |
| _CPM_Rate | 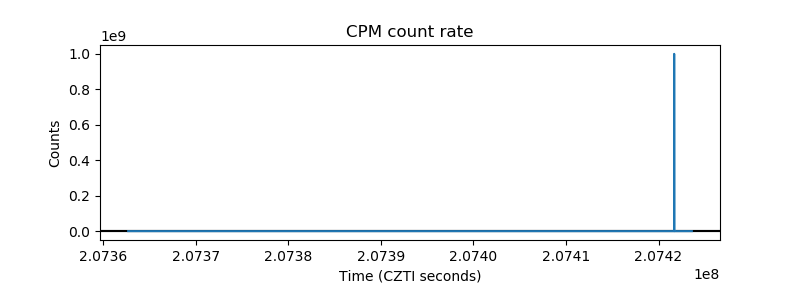 |
| CZT Counter |  |
| +2.5 Volts monitor |  |
| +5 Volts monitor |  |
| _ROLL_ROT |  |
| _Roll_DEC |  |
| _Roll_RA |  |
| Veto Counter |  |