| Param | Original file | Final file |
|---|---|---|
| Filename | modeM0/AS1G05_173T01_9000000564cztM0_level2_bc.evt | modeM0/AS1G05_173T01_9000000564cztM0_level2_quad_clean.evt |
| Size (bytes) | 343,402,560 | 144,904,320 |
| Size | 327.5 MB | 138.2 MB |
| Events in quadrant A | 2,550,416 | 913,197 |
| Events in quadrant B | 2,251,970 | 919,435 |
| Events in quadrant C | 2,240,103 | 906,884 |
| Events in quadrant D | 2,585,830 | 873,487 |
| Mode SS | |||
|---|---|---|---|
| Quadrant | BADHDUFLAG | Total packets | Discarded packets |
| A | 0 | 228 | 0 |
| B | 0 | 228 | 0 |
| C | 0 | 228 | 0 |
| D | 0 | 228 | 0 |
| Mode M0 | |||
|---|---|---|---|
| Quadrant | BADHDUFLAG | Total packets | Discarded packets |
| A | 0 | 24021 | 0 |
| B | 0 | 23080 | 0 |
| C | 0 | 23119 | 0 |
| D | 0 | 24550 | 0 |
| Mode M9 | |||
|---|---|---|---|
| Quadrant | BADHDUFLAG | Total packets | Discarded packets |
| A | 0 | 22 | 0 |
| B | 0 | 22 | 0 |
| C | 0 | 22 | 0 |
| D | 0 | 22 | 0 |
| Quadrant | Total seconds | Saturated seconds | Saturation percentage |
|---|---|---|---|
| A | 11210 | 101 | 0.900981% |
| B | 11209 | 72 | 0.642341% |
| C | 11210 | 60 | 0.535236% |
| D | 11210 | 160 | 1.427297% |
Noise dominated data is calculated using 1-second bins in cleaned event files. If a bin has >2000 counts, and if more than 50% of those come from <1% of pixels, then it is considered to be noise-dominated and hence unusable.
| Quadrant | # 1 sec bins | Bins with >0 counts | Bins with >2000 counts | High rate bins dominated by noise | Noise dominated (total time) | Noise dominated (detector-on time) | Marked lightcurve |
|---|---|---|---|---|---|---|---|
| A | 13320 | 11215 | 9 | 9 | 0.07% | 0.08% |  |
| B | 13320 | 11215 | 0 | 0 | 0.00% | 0.00% | 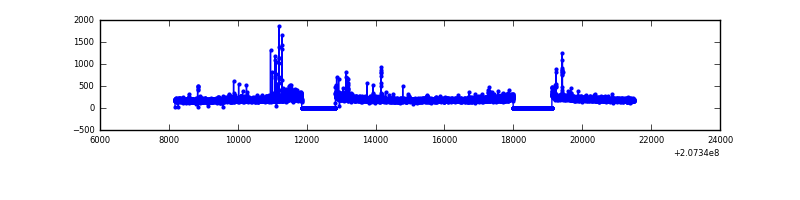 |
| C | 13320 | 11215 | 4 | 4 | 0.03% | 0.04% |  |
| D | 13320 | 11215 | 3 | 3 | 0.02% | 0.03% |  |
Top three noisy pixels from each quadrant. If the there are fewer than three noisy pixels in the level2.evt file, extra rows are filled as -1
| Pixel properties | Quadrant properties | ||||||
|---|---|---|---|---|---|---|---|
| Quadrant | DetID | PixID | Counts | Sigma | Mean | Median | Sigma |
| A | 0 | 13 | 437664 | 3676.31 | 534 | 523 | 118.9 |
| A | 7 | 16 | 34092 | 282.31 | 534 | 523 | 118.9 |
| A | 13 | 248 | 7638 | 59.84 | 534 | 523 | 118.9 |
| B | 15 | 204 | 69271 | 652.81 | 540 | 525 | 105.3 |
| B | 4 | 48 | 34393 | 321.61 | 540 | 525 | 105.3 |
| B | 4 | 80 | 31551 | 294.62 | 540 | 525 | 105.3 |
| C | 9 | 247 | 103061 | 859.1 | 526 | 516 | 119.4 |
| C | 14 | 67 | 28678 | 235.94 | 526 | 516 | 119.4 |
| C | 9 | 54 | 27766 | 228.3 | 526 | 516 | 119.4 |
| D | 13 | 235 | 306591 | 2504.54 | 525 | 504 | 122.2 |
| D | 2 | 136 | 70660 | 574.05 | 525 | 504 | 122.2 |
| D | 9 | 35 | 55465 | 449.72 | 525 | 504 | 122.2 |
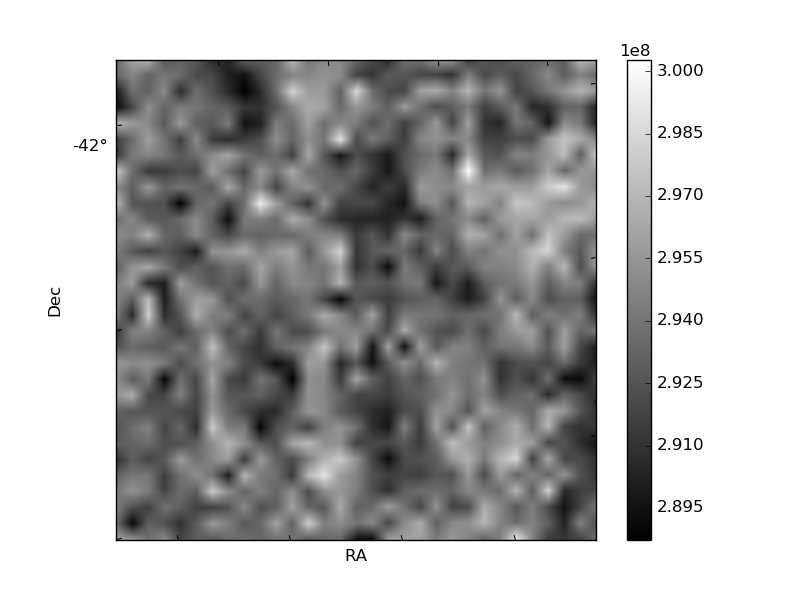
Histogram calculated using DETX and DETY for each event in the final _common_clean file
| Quadrant A |  |
 |
Quadrant B |
|---|---|---|---|
| Quadrant D | 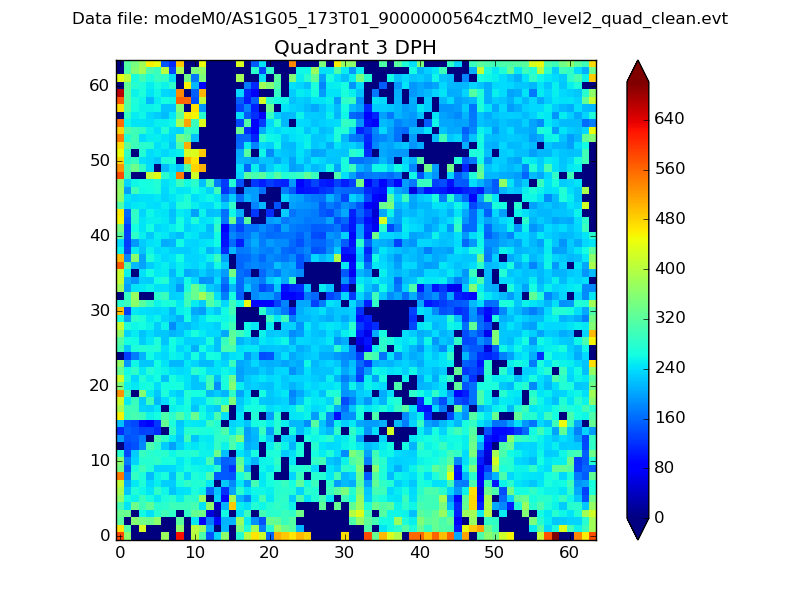 |
 |
Quadrant C |
| Plot type | Count rate plots | Images |
|---|---|---|
| Comparison with Poisson distribution Blue bars denote a histogram of data divided into 1 sec bins. Red curve is a Poisson curve with rate = median count rate of data. |
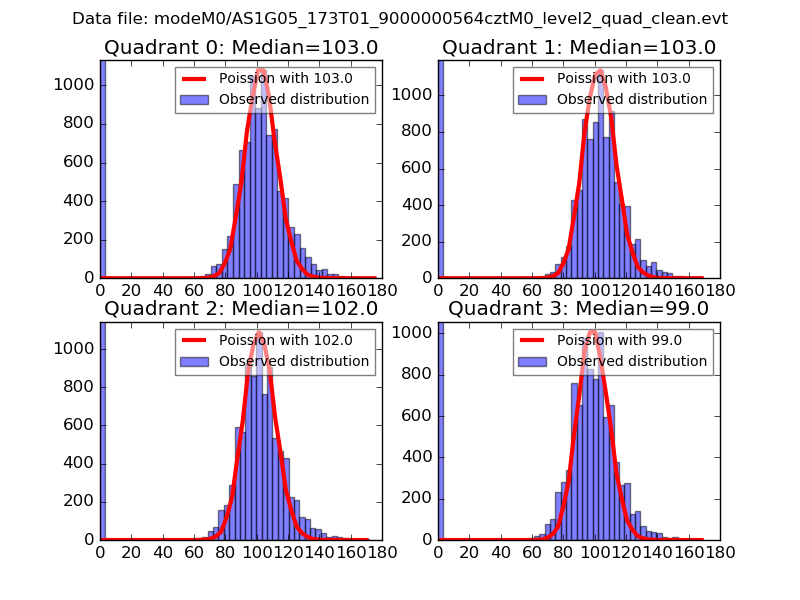 |
 |
| Quadrant-wise count rates Data is divided into 100 sec bins |
 |
|
| Module-wise count rates for Quadrant A Data is divided into 100 sec bins |
 |
 |
| Module-wise count rates for Quadrant B Data is divided into 100 sec bins |
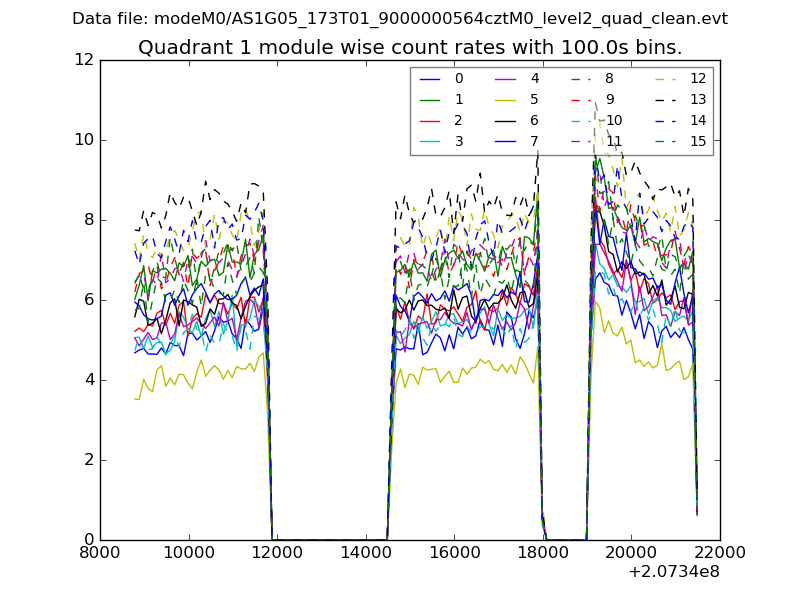 |
 |
| Module-wise count rates for Quadrant C Data is divided into 100 sec bins |
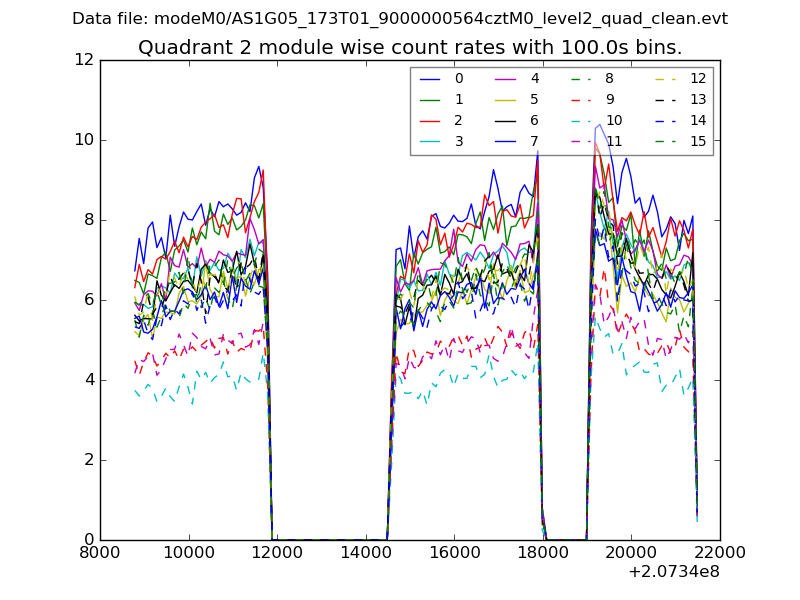 |
 |
| Module-wise count rates for Quadrant D Data is divided into 100 sec bins |
 |
 |
| Parameter | Plot |
|---|---|
| CZT HV Monitor | 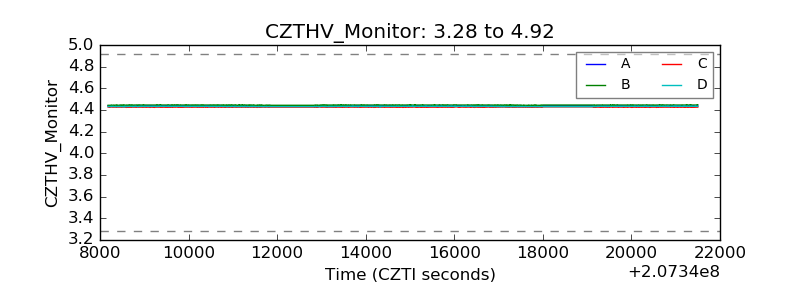 |
| D_VDD |  |
| Temperature 1 | 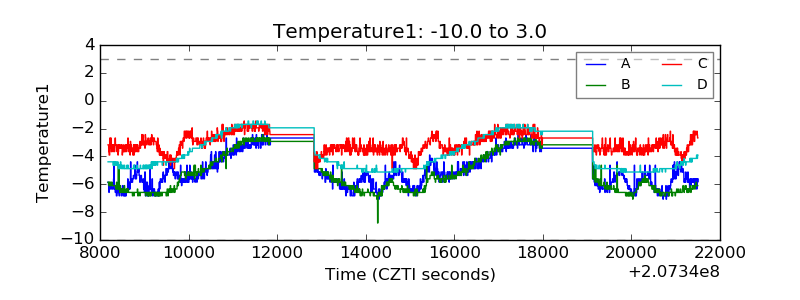 |
| Veto HV Monitor |  |
| Veto LLD |  |
| Alpha Counter |  |
| _CPM_Rate |  |
| CZT Counter | 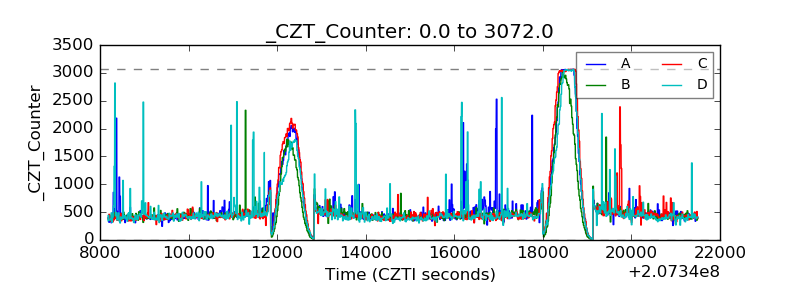 |
| +2.5 Volts monitor | 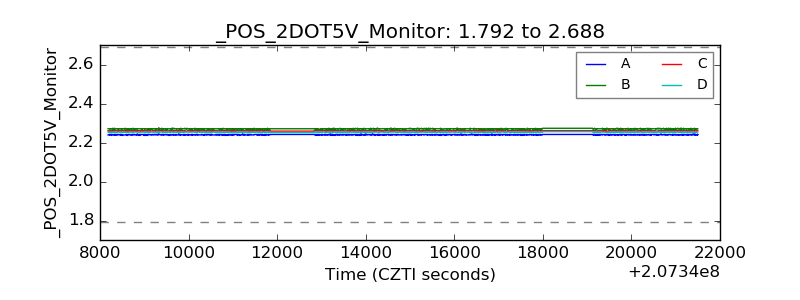 |
| +5 Volts monitor |  |
| _ROLL_ROT |  |
| _Roll_DEC | 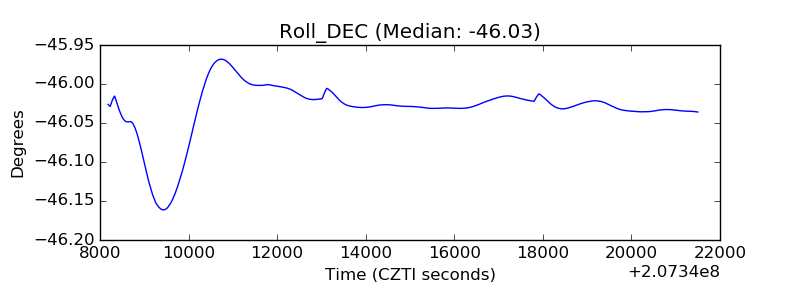 |
| _Roll_RA | 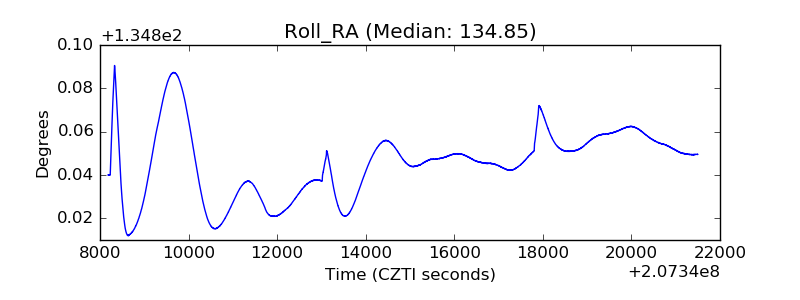 |
| Veto Counter |  |