| Param | Original file | Final file |
|---|---|---|
| Filename | modeM0/AS1G05_213T01_9000000556cztM0_level2_bc.evt | modeM0/AS1G05_213T01_9000000556cztM0_level2_quad_clean.evt |
| Size (bytes) | 99,959,040 | 57,507,840 |
| Size | 95.3 MB | 54.8 MB |
| Events in quadrant A | 701,402 | 375,622 |
| Events in quadrant B | 677,373 | 376,854 |
| Events in quadrant C | 675,550 | 375,483 |
| Events in quadrant D | 728,332 | 367,595 |
| Mode SS | |||
|---|---|---|---|
| Quadrant | BADHDUFLAG | Total packets | Discarded packets |
| A | 0 | 72 | 0 |
| B | 0 | 72 | 0 |
| C | 0 | 72 | 0 |
| D | 0 | 72 | 0 |
| Mode M0 | |||
|---|---|---|---|
| Quadrant | BADHDUFLAG | Total packets | Discarded packets |
| A | 0 | 7157 | 0 |
| B | 0 | 7060 | 0 |
| C | 0 | 7031 | 0 |
| D | 0 | 7186 | 0 |
| Mode M9 | |||
|---|---|---|---|
| Quadrant | BADHDUFLAG | Total packets | Discarded packets |
| A | 0 | 1 | 0 |
| B | 0 | 1 | 0 |
| C | 0 | 1 | 0 |
| D | 0 | 1 | 0 |
| Quadrant | Total seconds | Saturated seconds | Saturation percentage |
|---|---|---|---|
| A | 3466 | 37 | 1.067513% |
| B | 3466 | 43 | 1.240623% |
| C | 3466 | 32 | 0.923254% |
| D | 3466 | 30 | 0.865551% |
Noise dominated data is calculated using 1-second bins in cleaned event files. If a bin has >2000 counts, and if more than 50% of those come from <1% of pixels, then it is considered to be noise-dominated and hence unusable.
| Quadrant | # 1 sec bins | Bins with >0 counts | Bins with >2000 counts | High rate bins dominated by noise | Noise dominated (total time) | Noise dominated (detector-on time) | Marked lightcurve |
|---|---|---|---|---|---|---|---|
| A | 3466 | 3466 | 0 | 0 | 0.00% | 0.00% |  |
| B | 3466 | 3466 | 0 | 0 | 0.00% | 0.00% |  |
| C | 3466 | 3466 | 0 | 0 | 0.00% | 0.00% |  |
| D | 3466 | 3466 | 3 | 3 | 0.09% | 0.09% |  |
Top three noisy pixels from each quadrant. If the there are fewer than three noisy pixels in the level2.evt file, extra rows are filled as -1
| Pixel properties | Quadrant properties | ||||||
|---|---|---|---|---|---|---|---|
| Quadrant | DetID | PixID | Counts | Sigma | Mean | Median | Sigma |
| A | 0 | 118 | 23158 | 569.0 | 172 | 168 | 40.4 |
| A | 0 | 50 | 11441 | 279.0 | 172 | 168 | 40.4 |
| A | 0 | 226 | 2865 | 66.75 | 172 | 168 | 40.4 |
| B | 4 | 48 | 10039 | 280.98 | 172 | 168 | 35.1 |
| B | 14 | 167 | 2722 | 72.7 | 172 | 168 | 35.1 |
| B | 0 | 183 | 2534 | 67.35 | 172 | 168 | 35.1 |
| C | 9 | 16 | 15404 | 382.4 | 168 | 165 | 39.9 |
| C | 9 | 54 | 1143 | 24.54 | 168 | 165 | 39.9 |
| C | 13 | 61 | 1127 | 24.14 | 168 | 165 | 39.9 |
| D | 8 | 112 | 23056 | 546.24 | 170 | 163 | 41.9 |
| D | 4 | 95 | 20432 | 483.63 | 170 | 163 | 41.9 |
| D | 2 | 206 | 8950 | 209.66 | 170 | 163 | 41.9 |
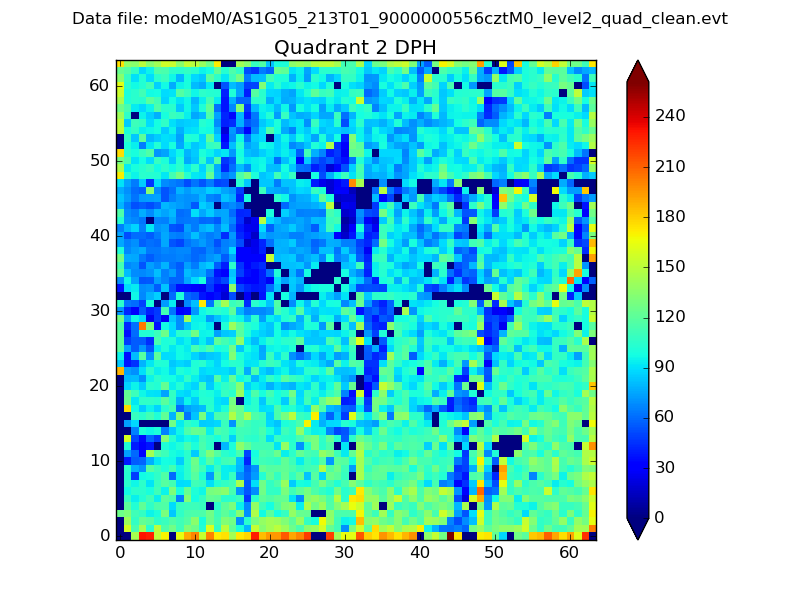
Histogram calculated using DETX and DETY for each event in the final _common_clean file
| Quadrant A |  |
 |
Quadrant B |
|---|---|---|---|
| Quadrant D |  |
 |
Quadrant C |
| Plot type | Count rate plots | Images |
|---|---|---|
| Comparison with Poisson distribution Blue bars denote a histogram of data divided into 1 sec bins. Red curve is a Poisson curve with rate = median count rate of data. |
 |
 |
| Quadrant-wise count rates Data is divided into 100 sec bins |
 |
|
| Module-wise count rates for Quadrant A Data is divided into 100 sec bins |
 |
 |
| Module-wise count rates for Quadrant B Data is divided into 100 sec bins |
 |
 |
| Module-wise count rates for Quadrant C Data is divided into 100 sec bins |
 |
 |
| Module-wise count rates for Quadrant D Data is divided into 100 sec bins |
 |
 |
| Parameter | Plot |
|---|---|
| CZT HV Monitor |  |
| D_VDD |  |
| Temperature 1 |  |
| Veto HV Monitor |  |
| Veto LLD |  |
| Alpha Counter |  |
| _CPM_Rate |  |
| CZT Counter |  |
| +2.5 Volts monitor |  |
| +5 Volts monitor |  |
| _ROLL_ROT |  |
| _Roll_DEC |  |
| _Roll_RA |  |
| Veto Counter |  |