| Param | Original file | Final file |
|---|---|---|
| Filename | modeM0/AS1G05_230T04_9000000550cztM0_level2_bc.evt | modeM0/AS1G05_230T04_9000000550cztM0_level2_quad_clean.evt |
| Size (bytes) | 5,619,012,480 | 1,456,611,840 |
| Size | 5.2 GB | 1.4 GB |
| Events in quadrant A | 25,914,156 | 9,364,811 |
| Events in quadrant B | 34,777,914 | 9,250,321 |
| Events in quadrant C | 23,611,151 | 9,473,908 |
| Events in quadrant D | 78,507,323 | 8,598,629 |
| Mode M0 | |||
|---|---|---|---|
| Quadrant | BADHDUFLAG | Total packets | Discarded packets |
| A | 0 | 239644 | 0 |
| B | 0 | 262764 | 0 |
| C | 0 | 229533 | 0 |
| D | 0 | 392909 | 0 |
| Mode SS | |||
|---|---|---|---|
| Quadrant | BADHDUFLAG | Total packets | Discarded packets |
| A | 0 | 2200 | 0 |
| B | 0 | 2200 | 0 |
| C | 0 | 2200 | 0 |
| D | 0 | 2200 | 0 |
| Mode M9 | |||
|---|---|---|---|
| Quadrant | BADHDUFLAG | Total packets | Discarded packets |
| A | 0 | 186 | 0 |
| B | 0 | 186 | 0 |
| C | 0 | 186 | 0 |
| D | 0 | 186 | 0 |
| Quadrant | Total seconds | Saturated seconds | Saturation percentage |
|---|---|---|---|
| A | 108370 | 2563 | 2.365046% |
| B | 108371 | 4353 | 4.016757% |
| C | 108371 | 960 | 0.885846% |
| D | 108371 | 15269 | 14.089563% |
Noise dominated data is calculated using 1-second bins in cleaned event files. If a bin has >2000 counts, and if more than 50% of those come from <1% of pixels, then it is considered to be noise-dominated and hence unusable.
| Quadrant | # 1 sec bins | Bins with >0 counts | Bins with >2000 counts | High rate bins dominated by noise | Noise dominated (total time) | Noise dominated (detector-on time) | Marked lightcurve |
|---|---|---|---|---|---|---|---|
| A | 126552 | 108373 | 96 | 96 | 0.08% | 0.09% |  |
| B | 126552 | 108372 | 1471 | 1471 | 1.16% | 1.36% |  |
| C | 126552 | 108373 | 7 | 7 | 0.01% | 0.01% |  |
| D | 126552 | 108374 | 8922 | 8922 | 7.05% | 8.23% |  |
Top three noisy pixels from each quadrant. If the there are fewer than three noisy pixels in the level2.evt file, extra rows are filled as -1
| Pixel properties | Quadrant properties | ||||||
|---|---|---|---|---|---|---|---|
| Quadrant | DetID | PixID | Counts | Sigma | Mean | Median | Sigma |
| A | 0 | 13 | 4420404 | 3816.24 | 5249 | 5133 | 1157.0 |
| A | 13 | 251 | 371920 | 317.02 | 5249 | 5133 | 1157.0 |
| A | 0 | 50 | 312368 | 265.55 | 5249 | 5133 | 1157.0 |
| B | 14 | 167 | 10676619 | 10635.8 | 5247 | 5096 | 1003.4 |
| B | 10 | 16 | 2524535 | 2511.0 | 5247 | 5096 | 1003.4 |
| B | 15 | 204 | 312743 | 306.62 | 5247 | 5096 | 1003.4 |
| C | 14 | 48 | 1878587 | 1606.43 | 5205 | 5116 | 1166.2 |
| C | 9 | 16 | 766692 | 653.02 | 5205 | 5116 | 1166.2 |
| C | 9 | 247 | 444705 | 376.93 | 5205 | 5116 | 1166.2 |
| D | 13 | 114 | 52511756 | 44392.07 | 5051 | 4867 | 1182.8 |
| D | 13 | 53 | 1455617 | 1226.54 | 5051 | 4867 | 1182.8 |
| D | 2 | 136 | 811420 | 681.9 | 5051 | 4867 | 1182.8 |
Histogram calculated using DETX and DETY for each event in the final _common_clean file
| Quadrant A | 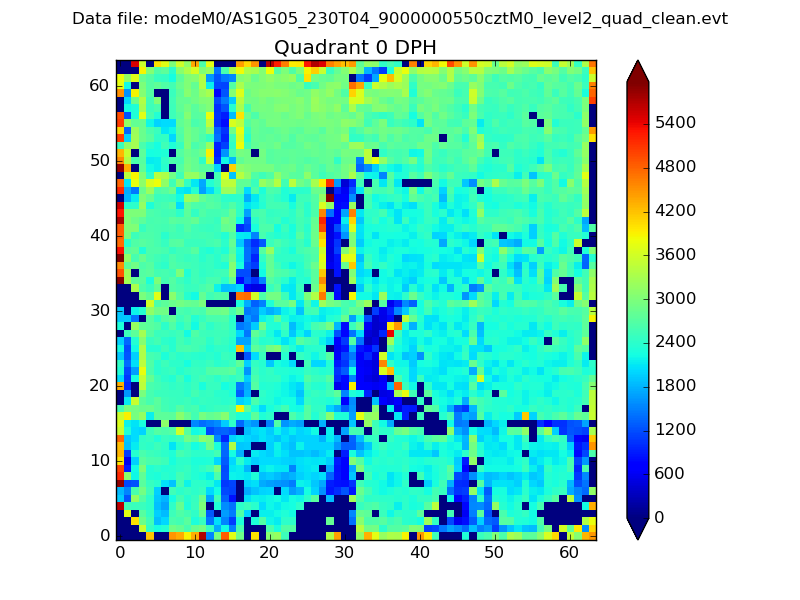 |
 |
Quadrant B |
|---|---|---|---|
| Quadrant D |  |
 |
Quadrant C |
| Plot type | Count rate plots | Images |
|---|---|---|
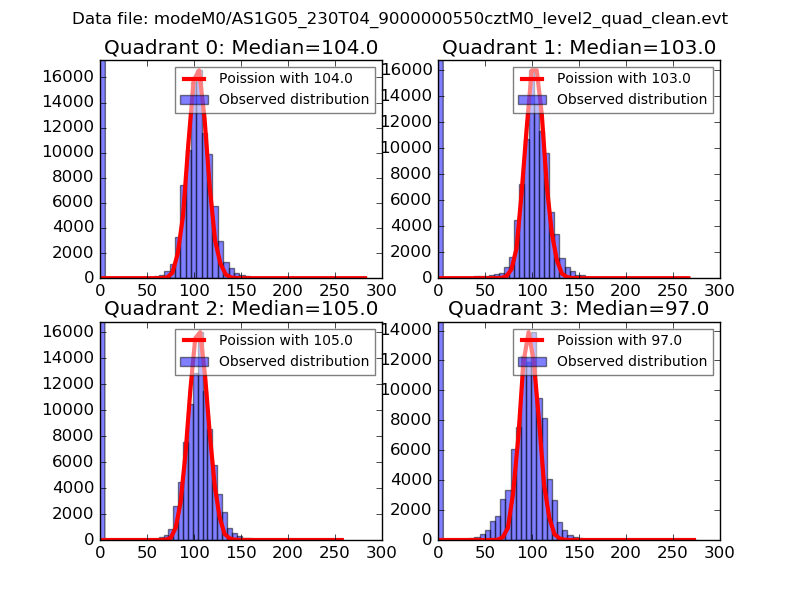
| Comparison with Poisson distribution Blue bars denote a histogram of data divided into 1 sec bins. Red curve is a Poisson curve with rate = median count rate of data. |
 |
 |
| Quadrant-wise count rates Data is divided into 100 sec bins |
 |
|
| Module-wise count rates for Quadrant A Data is divided into 100 sec bins |
 |
 |
| Module-wise count rates for Quadrant B Data is divided into 100 sec bins |
 |
 |
| Module-wise count rates for Quadrant C Data is divided into 100 sec bins |
 |
 |
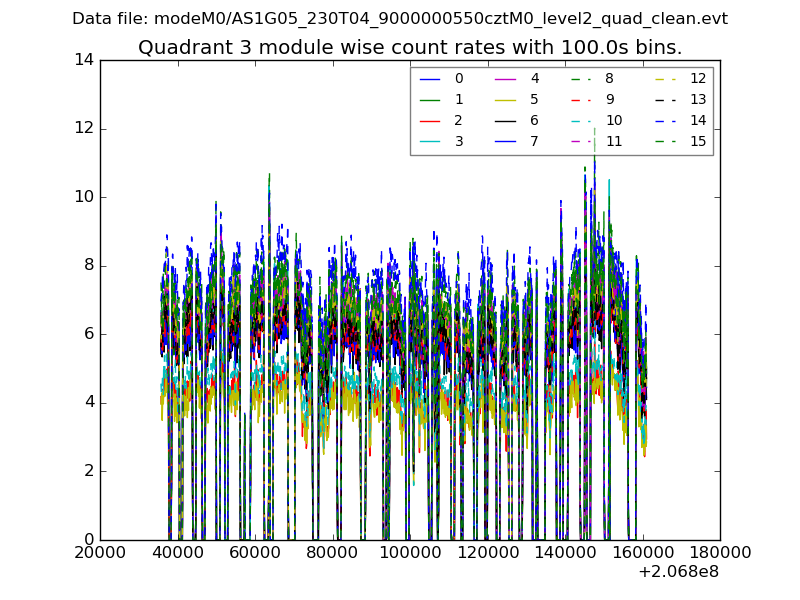
| Module-wise count rates for Quadrant D Data is divided into 100 sec bins |
 |
 |
| Parameter | Plot |
|---|---|
| CZT HV Monitor |  |
| D_VDD |  |
| Temperature 1 | 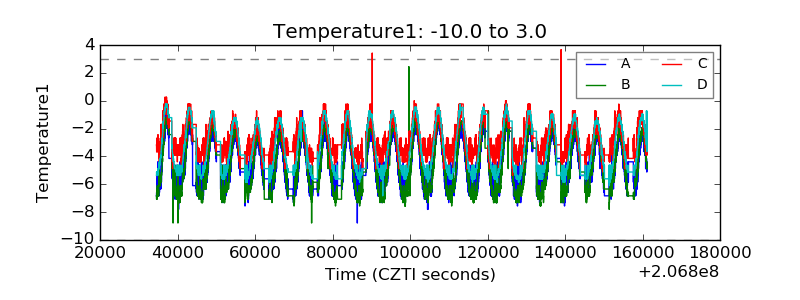 |
| Veto HV Monitor |  |
| Veto LLD | 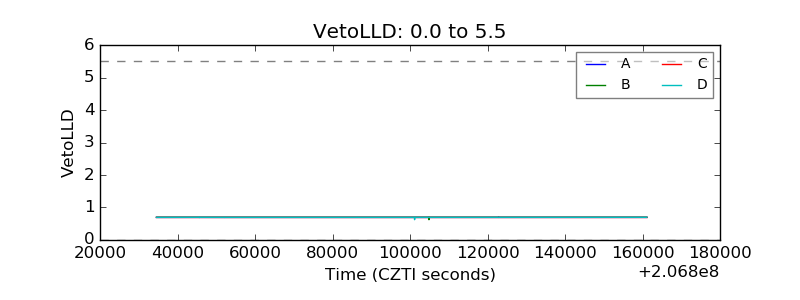 |
| Alpha Counter |  |
| _CPM_Rate |  |
| CZT Counter | 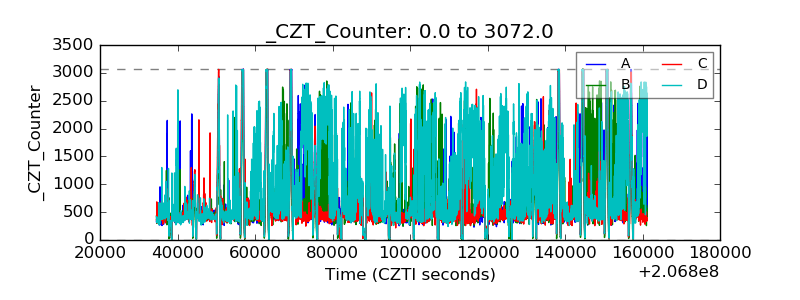 |
| +2.5 Volts monitor |  |
| +5 Volts monitor |  |
| _ROLL_ROT |  |
| _Roll_DEC |  |
| _Roll_RA |  |
| Veto Counter |  |