| Param | Original file | Final file |
|---|---|---|
| Filename | modeM0/AS1G05_230T02_9000000548cztM0_level2_bc.evt | modeM0/AS1G05_230T02_9000000548cztM0_level2_quad_clean.evt |
| Size (bytes) | 3,697,706,880 | 1,417,489,920 |
| Size | 3.4 GB | 1.3 GB |
| Events in quadrant A | 21,965,086 | 8,949,875 |
| Events in quadrant B | 26,920,467 | 8,858,033 |
| Events in quadrant C | 25,134,083 | 8,839,639 |
| Events in quadrant D | 30,330,762 | 8,608,988 |
| Mode M9 | |||
|---|---|---|---|
| Quadrant | BADHDUFLAG | Total packets | Discarded packets |
| A | 0 | 153 | 0 |
| B | 0 | 152 | 0 |
| C | 0 | 152 | 0 |
| D | 0 | 153 | 0 |
| Mode M0 | |||
|---|---|---|---|
| Quadrant | BADHDUFLAG | Total packets | Discarded packets |
| A | 0 | 230897 | 0 |
| B | 0 | 245773 | 0 |
| C | 0 | 241630 | 0 |
| D | 0 | 259342 | 0 |
| Mode SS | |||
|---|---|---|---|
| Quadrant | BADHDUFLAG | Total packets | Discarded packets |
| A | 0 | 2286 | 0 |
| B | 0 | 2286 | 0 |
| C | 0 | 2286 | 0 |
| D | 0 | 2286 | 0 |
| Quadrant | Total seconds | Saturated seconds | Saturation percentage |
|---|---|---|---|
| A | 112032 | 1347 | 1.202335% |
| B | 112034 | 2148 | 1.917275% |
| C | 112033 | 1554 | 1.387091% |
| D | 112033 | 2146 | 1.915507% |
Noise dominated data is calculated using 1-second bins in cleaned event files. If a bin has >2000 counts, and if more than 50% of those come from <1% of pixels, then it is considered to be noise-dominated and hence unusable.
| Quadrant | # 1 sec bins | Bins with >0 counts | Bins with >2000 counts | High rate bins dominated by noise | Noise dominated (total time) | Noise dominated (detector-on time) | Marked lightcurve |
|---|---|---|---|---|---|---|---|
| A | 127103 | 112034 | 13 | 13 | 0.01% | 0.01% |  |
| B | 127103 | 112035 | 177 | 177 | 0.14% | 0.16% |  |
| C | 127103 | 112035 | 70 | 70 | 0.06% | 0.06% |  |
| D | 127103 | 112036 | 110 | 110 | 0.09% | 0.10% |  |
Top three noisy pixels from each quadrant. If the there are fewer than three noisy pixels in the level2.evt file, extra rows are filled as -1
| Pixel properties | Quadrant properties | ||||||
|---|---|---|---|---|---|---|---|
| Quadrant | DetID | PixID | Counts | Sigma | Mean | Median | Sigma |
| A | 0 | 50 | 475645 | 398.92 | 5328 | 5216 | 1179.3 |
| A | 8 | 15 | 396991 | 332.22 | 5328 | 5216 | 1179.3 |
| A | 13 | 14 | 169689 | 139.47 | 5328 | 5216 | 1179.3 |
| B | 14 | 167 | 2575680 | 2485.97 | 5336 | 5176 | 1034.0 |
| B | 10 | 16 | 2279234 | 2199.27 | 5336 | 5176 | 1034.0 |
| B | 7 | 252 | 539111 | 516.37 | 5336 | 5176 | 1034.0 |
| C | 9 | 247 | 1957668 | 1666.74 | 5241 | 5160 | 1171.5 |
| C | 9 | 16 | 1685879 | 1434.73 | 5241 | 5160 | 1171.5 |
| C | 14 | 48 | 544456 | 460.37 | 5241 | 5160 | 1171.5 |
| D | 2 | 63 | 3689526 | 2976.36 | 5287 | 5087 | 1237.9 |
| D | 2 | 37 | 1331132 | 1071.21 | 5287 | 5087 | 1237.9 |
| D | 9 | 35 | 891399 | 715.98 | 5287 | 5087 | 1237.9 |
Histogram calculated using DETX and DETY for each event in the final _common_clean file
| Quadrant A |  |
 |
Quadrant B |
|---|---|---|---|
| Quadrant D | 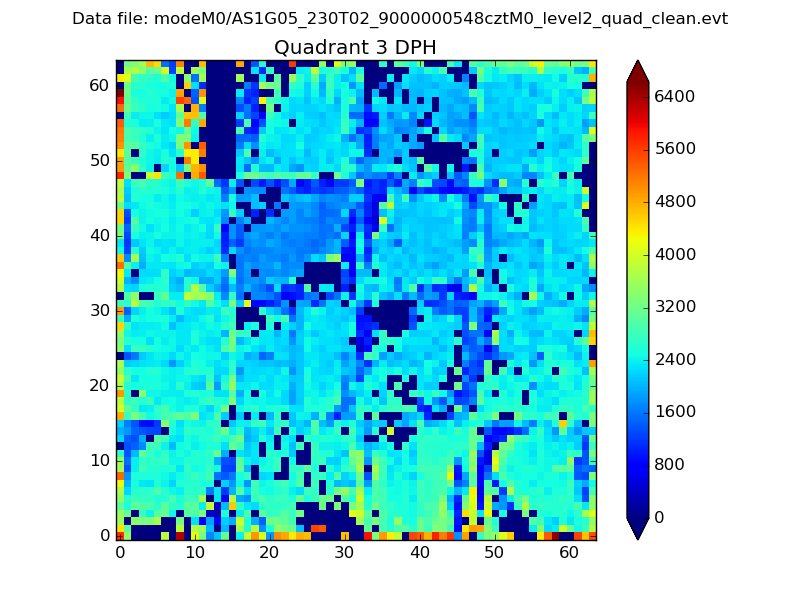 |
 |
Quadrant C |
| Plot type | Count rate plots | Images |
|---|---|---|
| Comparison with Poisson distribution Blue bars denote a histogram of data divided into 1 sec bins. Red curve is a Poisson curve with rate = median count rate of data. |
 |
 |
| Quadrant-wise count rates Data is divided into 100 sec bins |
 |
|
| Module-wise count rates for Quadrant A Data is divided into 100 sec bins |
 |
 |
| Module-wise count rates for Quadrant B Data is divided into 100 sec bins |
 |
 |
| Module-wise count rates for Quadrant C Data is divided into 100 sec bins |
 |
 |
| Module-wise count rates for Quadrant D Data is divided into 100 sec bins |
 |
 |
| Parameter | Plot |
|---|---|
| CZT HV Monitor |  |
| D_VDD |  |
| Temperature 1 |  |
| Veto HV Monitor |  |
| Veto LLD |  |
| Alpha Counter |  |
| _CPM_Rate |  |
| CZT Counter |  |
| +2.5 Volts monitor |  |
| +5 Volts monitor |  |
| _ROLL_ROT |  |
| _Roll_DEC |  |
| _Roll_RA | 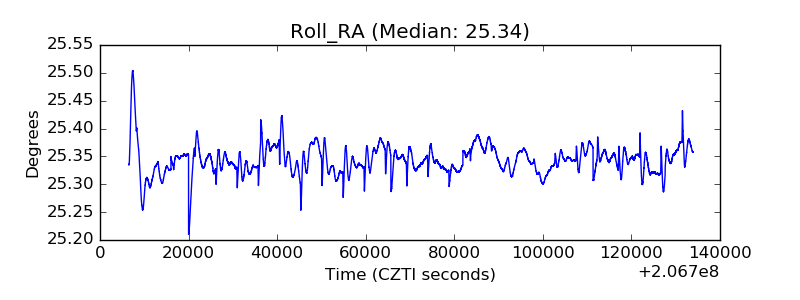 |
| Veto Counter |  |