| Param | Original file | Final file |
|---|---|---|
| Filename | modeM0/AS1G05_167T02_9000000546cztM0_level2_bc.evt | modeM0/AS1G05_167T02_9000000546cztM0_level2_quad_clean.evt |
| Size (bytes) | 955,428,480 | 288,014,400 |
| Size | 911.2 MB | 274.7 MB |
| Events in quadrant A | 6,335,569 | 1,677,709 |
| Events in quadrant B | 6,403,300 | 1,711,793 |
| Events in quadrant C | 6,874,344 | 1,678,118 |
| Events in quadrant D | 7,282,035 | 1,603,457 |
| Mode M9 | |||
|---|---|---|---|
| Quadrant | BADHDUFLAG | Total packets | Discarded packets |
| A | 0 | 57 | 0 |
| B | 0 | 57 | 0 |
| C | 0 | 57 | 0 |
| D | 0 | 57 | 0 |
| Mode M0 | |||
|---|---|---|---|
| Quadrant | BADHDUFLAG | Total packets | Discarded packets |
| A | 0 | 62342 | 0 |
| B | 0 | 62156 | 0 |
| C | 0 | 64389 | 0 |
| D | 0 | 65318 | 0 |
| Mode SS | |||
|---|---|---|---|
| Quadrant | BADHDUFLAG | Total packets | Discarded packets |
| A | 0 | 606 | 0 |
| B | 0 | 606 | 0 |
| C | 0 | 606 | 0 |
| D | 0 | 606 | 0 |
| Quadrant | Total seconds | Saturated seconds | Saturation percentage |
|---|---|---|---|
| A | 29852 | 215 | 0.720220% |
| B | 29851 | 238 | 0.797293% |
| C | 29852 | 292 | 0.978159% |
| D | 29854 | 295 | 0.988142% |
Noise dominated data is calculated using 1-second bins in cleaned event files. If a bin has >2000 counts, and if more than 50% of those come from <1% of pixels, then it is considered to be noise-dominated and hence unusable.
| Quadrant | # 1 sec bins | Bins with >0 counts | Bins with >2000 counts | High rate bins dominated by noise | Noise dominated (total time) | Noise dominated (detector-on time) | Marked lightcurve |
|---|---|---|---|---|---|---|---|
| A | 35459 | 29855 | 4 | 4 | 0.01% | 0.01% |  |
| B | 35459 | 29853 | 11 | 11 | 0.03% | 0.04% |  |
| C | 35459 | 29855 | 12 | 12 | 0.03% | 0.04% |  |
| D | 35459 | 29854 | 33 | 33 | 0.09% | 0.11% |  |
Top three noisy pixels from each quadrant. If the there are fewer than three noisy pixels in the level2.evt file, extra rows are filled as -1
| Pixel properties | Quadrant properties | ||||||
|---|---|---|---|---|---|---|---|
| Quadrant | DetID | PixID | Counts | Sigma | Mean | Median | Sigma |
| A | 13 | 251 | 343262 | 1030.55 | 1500 | 1464 | 331.7 |
| A | 15 | 234 | 74869 | 221.32 | 1500 | 1464 | 331.7 |
| A | 7 | 16 | 47889 | 139.98 | 1500 | 1464 | 331.7 |
| B | 14 | 167 | 309032 | 1063.29 | 1530 | 1488 | 289.2 |
| B | 5 | 200 | 105541 | 359.75 | 1530 | 1488 | 289.2 |
| B | 15 | 204 | 71709 | 242.78 | 1530 | 1488 | 289.2 |
| C | 9 | 247 | 670115 | 2014.96 | 1477 | 1454 | 331.8 |
| C | 14 | 48 | 333828 | 1001.59 | 1477 | 1454 | 331.8 |
| C | 9 | 16 | 34503 | 99.59 | 1477 | 1454 | 331.8 |
| D | 2 | 37 | 529987 | 1557.82 | 1466 | 1413 | 339.3 |
| D | 13 | 239 | 363979 | 1068.56 | 1466 | 1413 | 339.3 |
| D | 9 | 35 | 211691 | 619.73 | 1466 | 1413 | 339.3 |
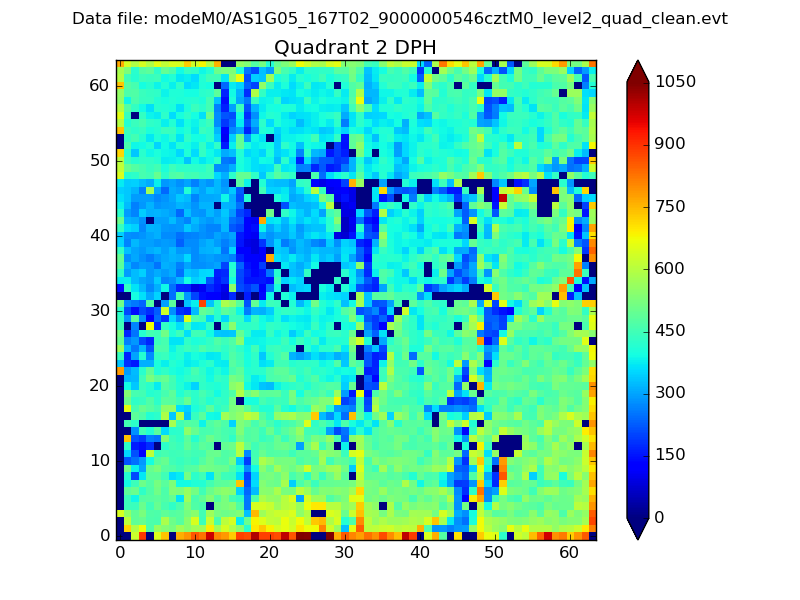
Histogram calculated using DETX and DETY for each event in the final _common_clean file
| Quadrant A |  |
 |
Quadrant B |
|---|---|---|---|
| Quadrant D | 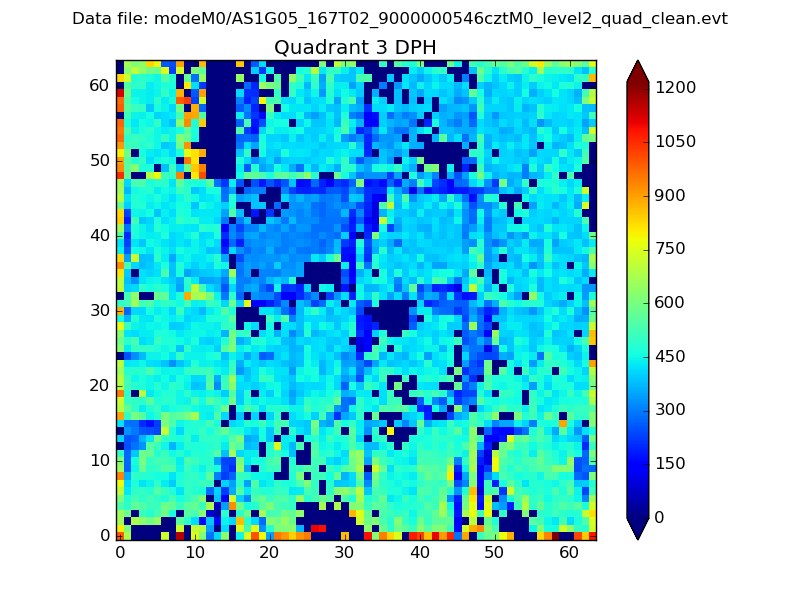 |
 |
Quadrant C |
| Plot type | Count rate plots | Images |
|---|---|---|
| Comparison with Poisson distribution Blue bars denote a histogram of data divided into 1 sec bins. Red curve is a Poisson curve with rate = median count rate of data. |
 |
 |
| Quadrant-wise count rates Data is divided into 100 sec bins |
 |
|
| Module-wise count rates for Quadrant A Data is divided into 100 sec bins |
 |
 |
| Module-wise count rates for Quadrant B Data is divided into 100 sec bins |
 |
 |
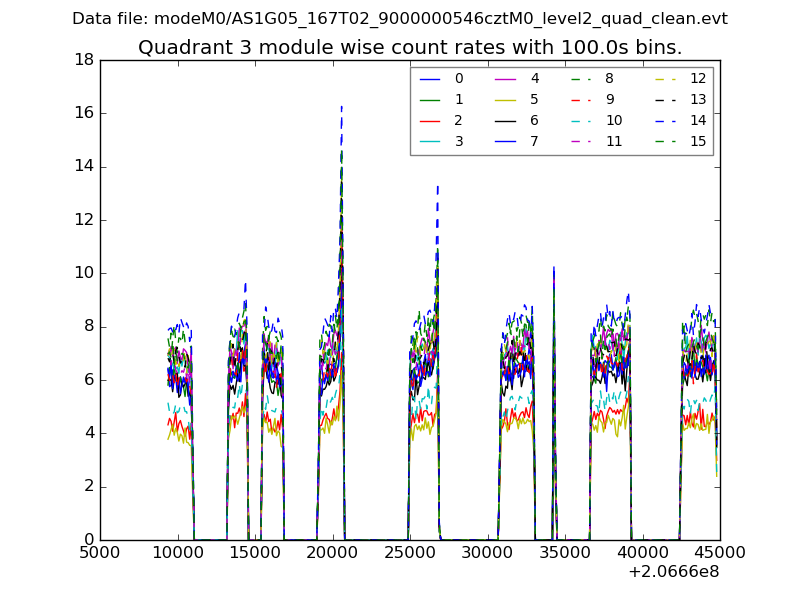
| Module-wise count rates for Quadrant C Data is divided into 100 sec bins |
 |
 |
| Module-wise count rates for Quadrant D Data is divided into 100 sec bins |
 |
 |
| Parameter | Plot |
|---|---|
| CZT HV Monitor | 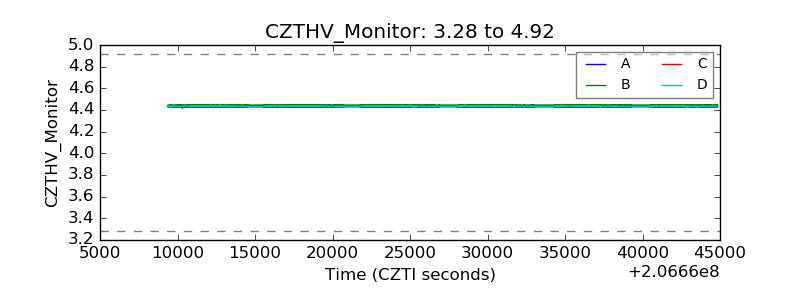 |
| D_VDD |  |
| Temperature 1 | 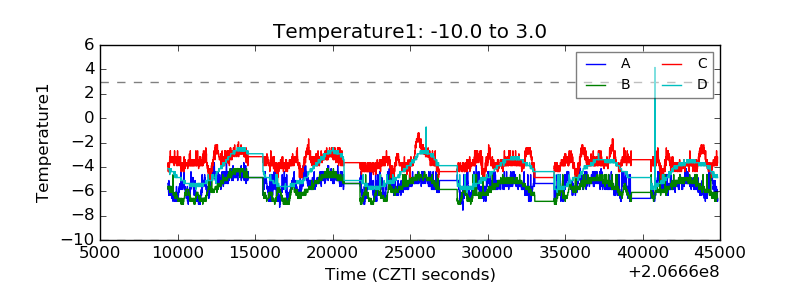 |
| Veto HV Monitor | 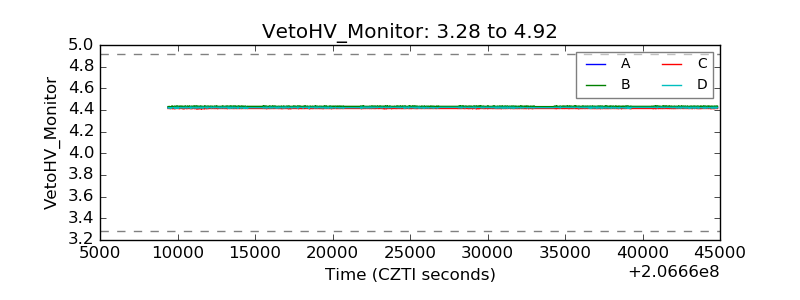 |
| Veto LLD |  |
| Alpha Counter |  |
| _CPM_Rate | 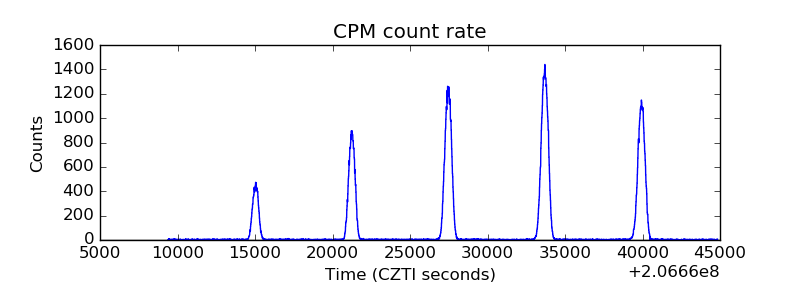 |
| CZT Counter |  |
| +2.5 Volts monitor |  |
| +5 Volts monitor |  |
| _ROLL_ROT |  |
| _Roll_DEC |  |
| _Roll_RA | 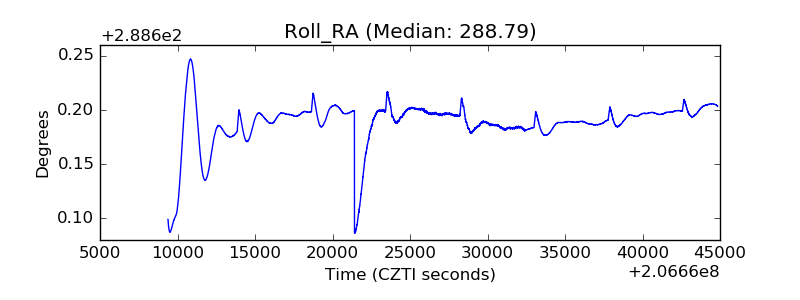 |
| Veto Counter | 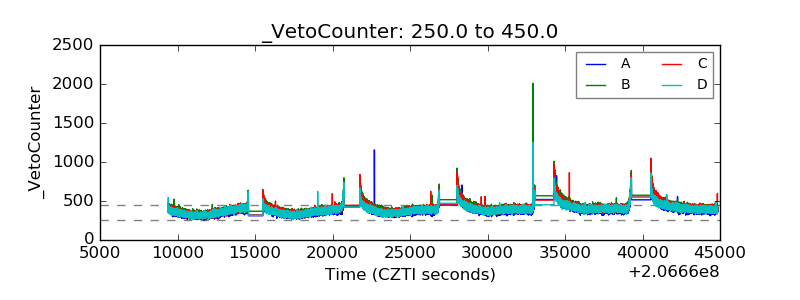 |