| Param | Original file | Final file |
|---|---|---|
| Filename | modeM0/AS1G05_252T01_9000000544cztM0_level2.evt | modeM0/AS1G05_252T01_9000000544cztM0_level2_quad_clean.evt |
| Size (bytes) | 6,070,314,240 | 974,926,080 |
| Size | 5.7 GB | 929.8 MB |
| Events in quadrant A | 54,483,448 | 6,001,253 |
| Events in quadrant B | 38,819,926 | 6,192,183 |
| Events in quadrant C | 41,427,073 | 6,005,783 |
| Events in quadrant D | 43,699,760 | 5,825,341 |
| Mode SS | |||
|---|---|---|---|
| Quadrant | BADHDUFLAG | Total packets | Discarded packets |
| A | 0 | 1638 | 0 |
| B | 0 | 1638 | 0 |
| C | 0 | 1638 | 0 |
| D | 0 | 1638 | 0 |
| Mode M9 | |||
|---|---|---|---|
| Quadrant | BADHDUFLAG | Total packets | Discarded packets |
| A | 0 | 115 | 0 |
| B | 0 | 115 | 0 |
| C | 0 | 115 | 0 |
| D | 0 | 115 | 0 |
| Mode M0 | |||
|---|---|---|---|
| Quadrant | BADHDUFLAG | Total packets | Discarded packets |
| A | 0 | 216423 | 0 |
| B | 0 | 168259 | 0 |
| C | 0 | 178244 | 0 |
| D | 0 | 186946 | 0 |
| Quadrant | Total seconds | Saturated seconds | Saturation percentage |
|---|---|---|---|
| A | 80273 | 4089 | 5.093867% |
| B | 80271 | 892 | 1.111236% |
| C | 80269 | 1245 | 1.551035% |
| D | 80274 | 1929 | 2.403020% |
Noise dominated data is calculated using 1-second bins in cleaned event files. If a bin has >2000 counts, and if more than 50% of those come from <1% of pixels, then it is considered to be noise-dominated and hence unusable.
| Quadrant | # 1 sec bins | Bins with >0 counts | Bins with >2000 counts | High rate bins dominated by noise | Noise dominated (total time) | Noise dominated (detector-on time) | Marked lightcurve |
|---|---|---|---|---|---|---|---|
| A | 92563 | 80281 | 2804 | 2804 | 3.03% | 3.49% |  |
| B | 92563 | 80280 | 175 | 175 | 0.19% | 0.22% | 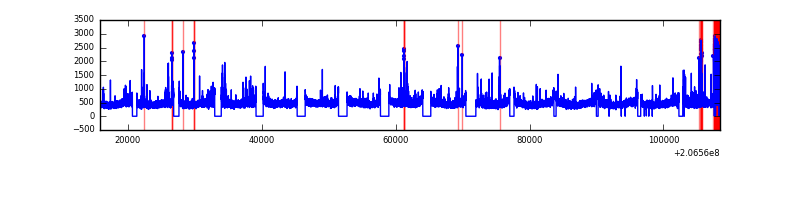 |
| C | 92563 | 80285 | 642 | 642 | 0.69% | 0.80% | 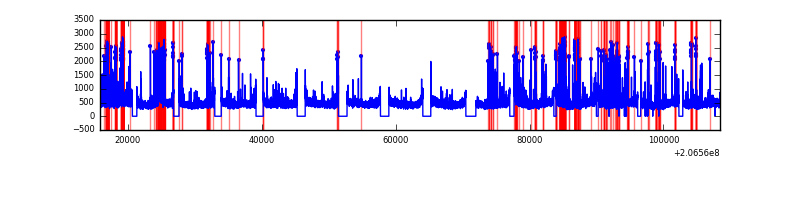 |
| D | 92563 | 80286 | 1166 | 1166 | 1.26% | 1.45% |  |
Top three noisy pixels from each quadrant. If the there are fewer than three noisy pixels in the level2.evt file, extra rows are filled as -1
| Pixel properties | Quadrant properties | ||||||
|---|---|---|---|---|---|---|---|
| Quadrant | DetID | PixID | Counts | Sigma | Mean | Median | Sigma |
| A | 13 | 251 | 17355449 | 9148.08 | 9377 | 9199 | 1896.2 |
| A | 15 | 234 | 343812 | 176.47 | 9377 | 9199 | 1896.2 |
| A | 0 | 50 | 282727 | 144.25 | 9377 | 9199 | 1896.2 |
| B | 14 | 167 | 918768 | 499.53 | 9586 | 9361 | 1820.5 |
| B | 15 | 204 | 279830 | 148.57 | 9586 | 9361 | 1820.5 |
| B | 4 | 48 | 195186 | 102.07 | 9586 | 9361 | 1820.5 |
| C | 9 | 247 | 3024561 | 1422.74 | 9129 | 9156 | 2119.4 |
| C | 14 | 48 | 2128962 | 1000.18 | 9129 | 9156 | 2119.4 |
| C | 9 | 16 | 262303 | 119.44 | 9129 | 9156 | 2119.4 |
| D | 2 | 136 | 1818926 | 833.17 | 9096 | 8853 | 2172.5 |
| D | 2 | 63 | 1658157 | 759.17 | 9096 | 8853 | 2172.5 |
| D | 4 | 95 | 1272775 | 581.78 | 9096 | 8853 | 2172.5 |
Histogram calculated using DETX and DETY for each event in the final _common_clean file
| Quadrant A |  |
 |
Quadrant B |
|---|---|---|---|
| Quadrant D |  |
 |
Quadrant C |
| Plot type | Count rate plots | Images |
|---|---|---|
| Comparison with Poisson distribution Blue bars denote a histogram of data divided into 1 sec bins. Red curve is a Poisson curve with rate = median count rate of data. |
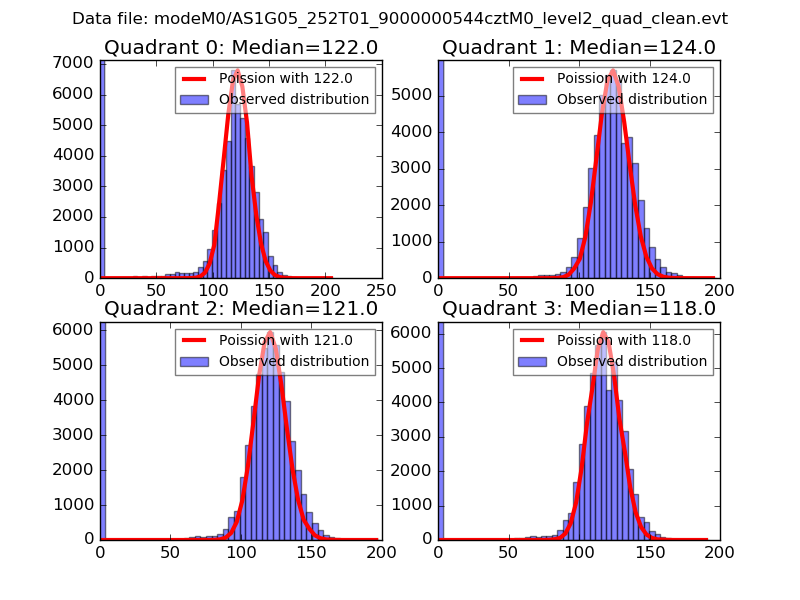 |
 |
| Quadrant-wise count rates Data is divided into 100 sec bins |
 |
|
| Module-wise count rates for Quadrant A Data is divided into 100 sec bins |
 |
 |
| Module-wise count rates for Quadrant B Data is divided into 100 sec bins |
 |
 |
| Module-wise count rates for Quadrant C Data is divided into 100 sec bins |
 |
 |
| Module-wise count rates for Quadrant D Data is divided into 100 sec bins |
 |
 |
| Parameter | Plot |
|---|---|
| CZT HV Monitor |  |
| D_VDD |  |
| Temperature 1 |  |
| Veto HV Monitor |  |
| Veto LLD | 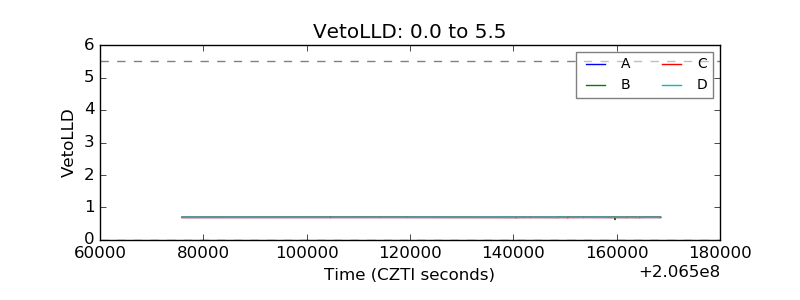 |
| Alpha Counter |  |
| _CPM_Rate | 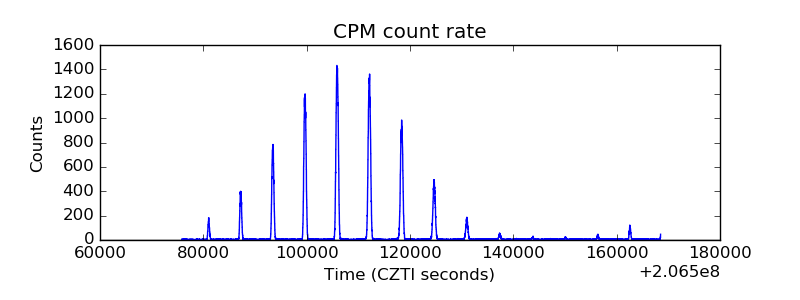 |
| CZT Counter |  |
| +2.5 Volts monitor |  |
| +5 Volts monitor | 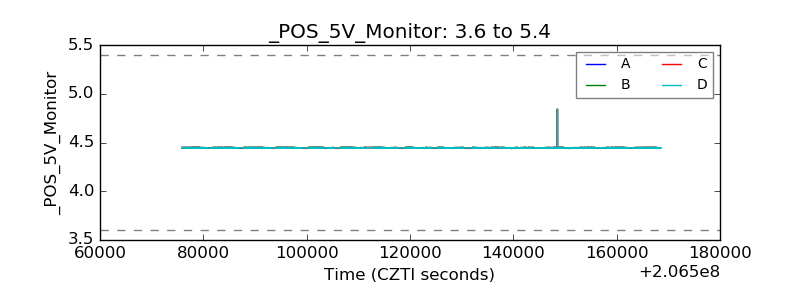 |
| _ROLL_ROT |  |
| _Roll_DEC | 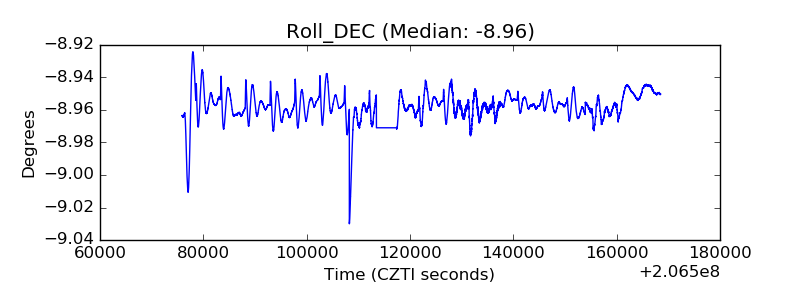 |
| _Roll_RA |  |
| Veto Counter |  |