| Param | Original file | Final file |
|---|---|---|
| Filename | modeM0/AS1G05_167T01_9000000542cztM0_level2_bc.evt | modeM0/AS1G05_167T01_9000000542cztM0_level2_quad_clean.evt |
| Size (bytes) | 762,194,880 | 265,227,840 |
| Size | 726.9 MB | 252.9 MB |
| Events in quadrant A | 4,860,792 | 1,673,414 |
| Events in quadrant B | 4,536,548 | 1,660,328 |
| Events in quadrant C | 7,064,086 | 1,611,575 |
| Events in quadrant D | 5,125,342 | 1,582,482 |
| Mode M9 | |||
|---|---|---|---|
| Quadrant | BADHDUFLAG | Total packets | Discarded packets |
| A | 0 | 10 | 0 |
| B | 0 | 10 | 0 |
| C | 0 | 10 | 0 |
| D | 0 | 10 | 0 |
| Mode M0 | |||
|---|---|---|---|
| Quadrant | BADHDUFLAG | Total packets | Discarded packets |
| A | 0 | 46784 | 0 |
| B | 0 | 45830 | 0 |
| C | 0 | 53643 | 0 |
| D | 0 | 47956 | 0 |
| Mode SS | |||
|---|---|---|---|
| Quadrant | BADHDUFLAG | Total packets | Discarded packets |
| A | 0 | 448 | 0 |
| B | 0 | 448 | 0 |
| C | 0 | 448 | 0 |
| D | 0 | 448 | 0 |
| Quadrant | Total seconds | Saturated seconds | Saturation percentage |
|---|---|---|---|
| A | 21861 | 297 | 1.358584% |
| B | 21861 | 287 | 1.312840% |
| C | 21859 | 735 | 3.362459% |
| D | 21858 | 368 | 1.683594% |
Noise dominated data is calculated using 1-second bins in cleaned event files. If a bin has >2000 counts, and if more than 50% of those come from <1% of pixels, then it is considered to be noise-dominated and hence unusable.
| Quadrant | # 1 sec bins | Bins with >0 counts | Bins with >2000 counts | High rate bins dominated by noise | Noise dominated (total time) | Noise dominated (detector-on time) | Marked lightcurve |
|---|---|---|---|---|---|---|---|
| A | 22727 | 21867 | 5 | 5 | 0.02% | 0.02% | 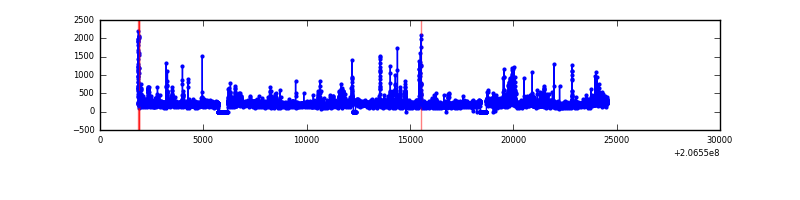 |
| B | 22727 | 21865 | 1 | 1 | 0.00% | 0.00% |  |
| C | 22727 | 21865 | 72 | 72 | 0.32% | 0.33% |  |
| D | 22727 | 21865 | 18 | 18 | 0.08% | 0.08% |  |
Top three noisy pixels from each quadrant. If the there are fewer than three noisy pixels in the level2.evt file, extra rows are filled as -1
| Pixel properties | Quadrant properties | ||||||
|---|---|---|---|---|---|---|---|
| Quadrant | DetID | PixID | Counts | Sigma | Mean | Median | Sigma |
| A | 13 | 251 | 349875 | 1382.25 | 1097 | 1073 | 252.3 |
| A | 15 | 234 | 128566 | 505.24 | 1097 | 1073 | 252.3 |
| A | 0 | 50 | 72314 | 282.32 | 1097 | 1073 | 252.3 |
| B | 15 | 204 | 101205 | 452.12 | 1104 | 1076 | 221.5 |
| B | 14 | 167 | 78956 | 351.66 | 1104 | 1076 | 221.5 |
| B | 4 | 48 | 48595 | 214.57 | 1104 | 1076 | 221.5 |
| C | 9 | 247 | 2374141 | 9785.79 | 1062 | 1050 | 242.5 |
| C | 9 | 16 | 411832 | 1693.92 | 1062 | 1050 | 242.5 |
| C | 10 | 65 | 56158 | 227.25 | 1062 | 1050 | 242.5 |
| D | 13 | 239 | 203558 | 780.42 | 1077 | 1035 | 259.5 |
| D | 2 | 63 | 183015 | 701.26 | 1077 | 1035 | 259.5 |
| D | 4 | 95 | 173911 | 666.18 | 1077 | 1035 | 259.5 |
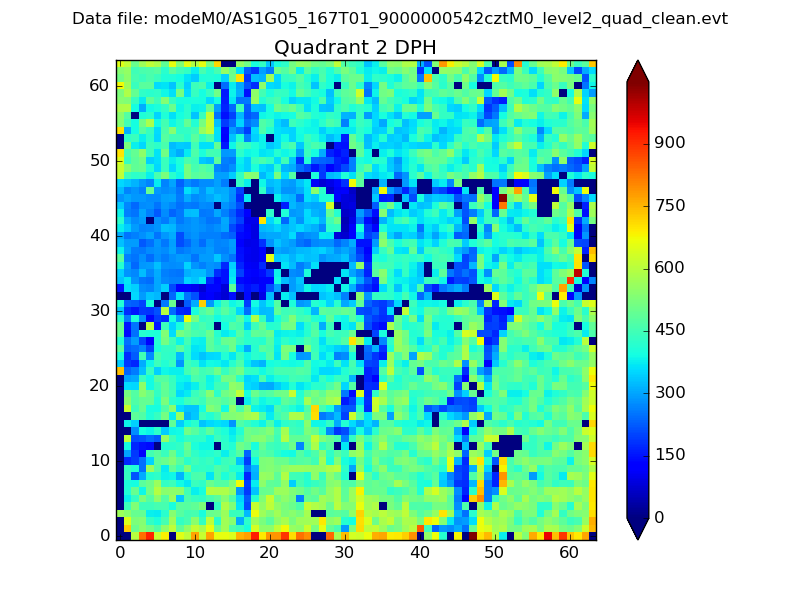
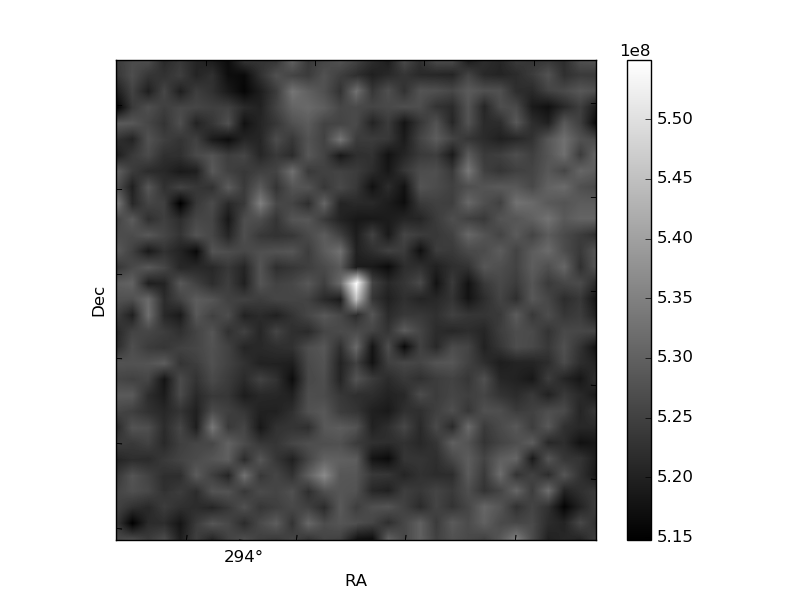
Histogram calculated using DETX and DETY for each event in the final _common_clean file
| Quadrant A |  |
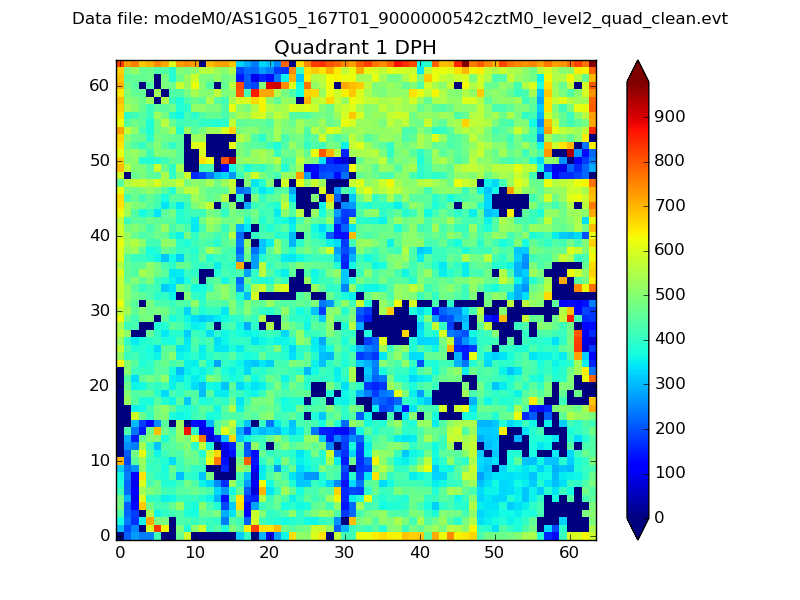 |
Quadrant B |
|---|---|---|---|
| Quadrant D | 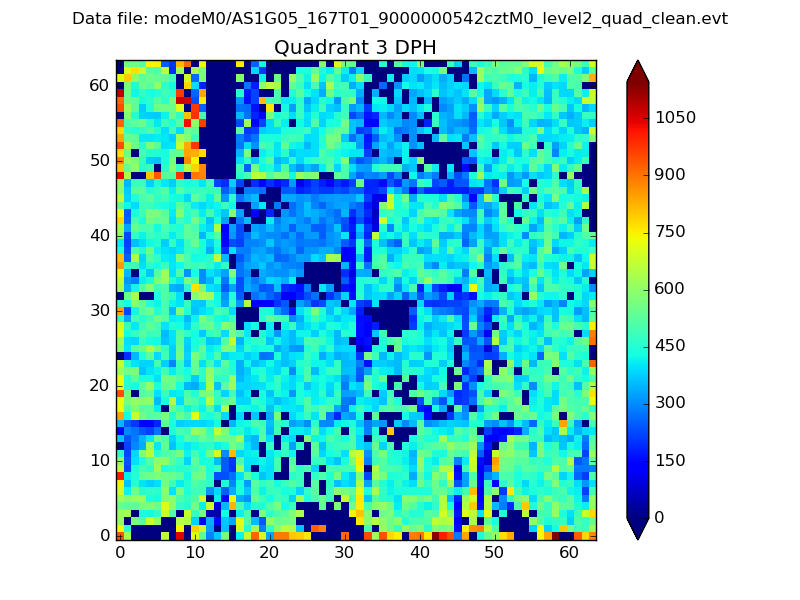 |
 |
Quadrant C |
| Plot type | Count rate plots | Images |
|---|---|---|
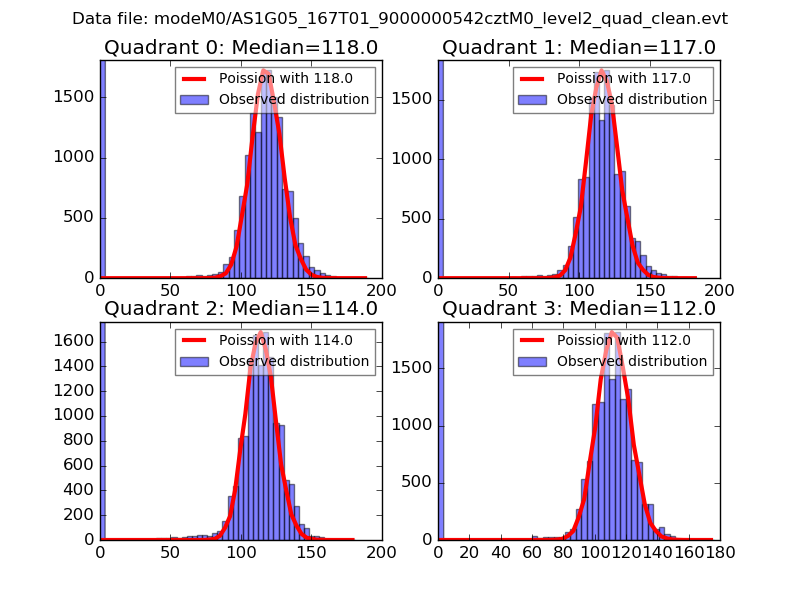
| Comparison with Poisson distribution Blue bars denote a histogram of data divided into 1 sec bins. Red curve is a Poisson curve with rate = median count rate of data. |
 |
 |
| Quadrant-wise count rates Data is divided into 100 sec bins |
 |
|
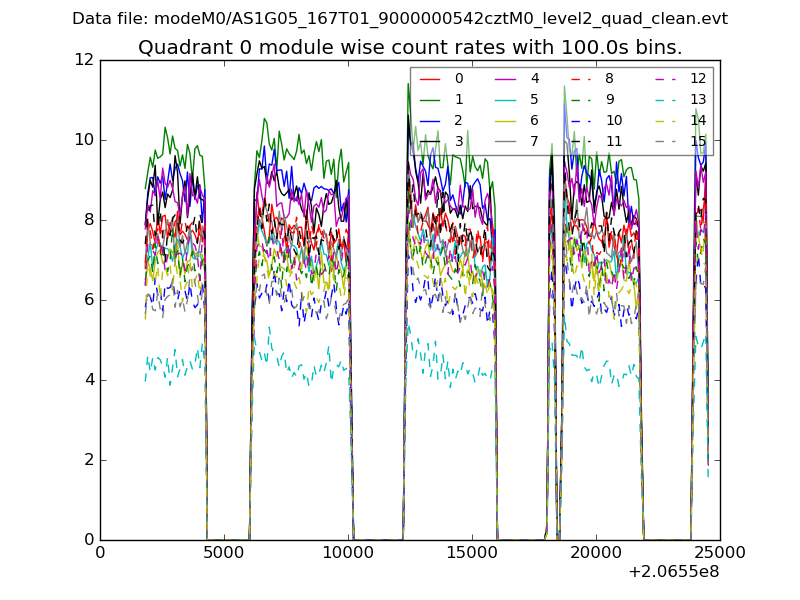
| Module-wise count rates for Quadrant A Data is divided into 100 sec bins |
 |
 |
| Module-wise count rates for Quadrant B Data is divided into 100 sec bins |
 |
 |
| Module-wise count rates for Quadrant C Data is divided into 100 sec bins |
 |
 |
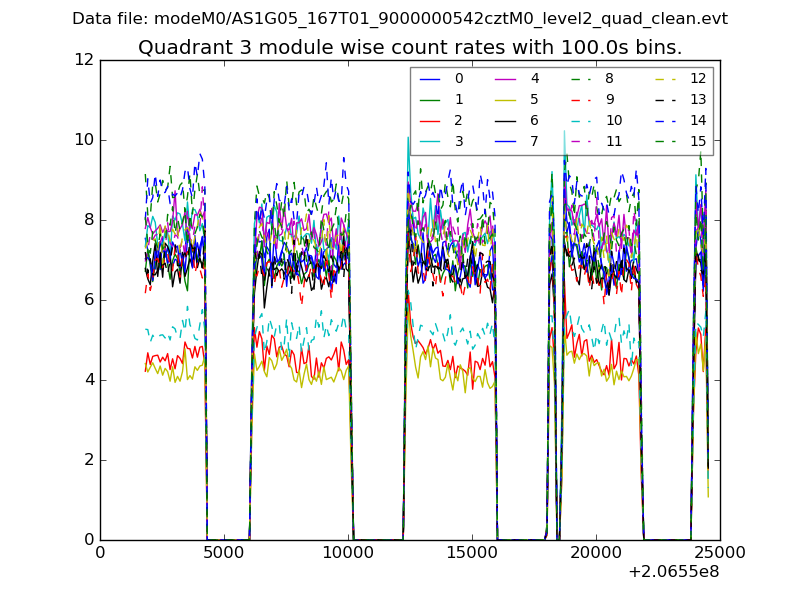
| Module-wise count rates for Quadrant D Data is divided into 100 sec bins |
 |
 |
| Parameter | Plot |
|---|---|
| CZT HV Monitor |  |
| D_VDD |  |
| Temperature 1 |  |
| Veto HV Monitor |  |
| Veto LLD |  |
| Alpha Counter | 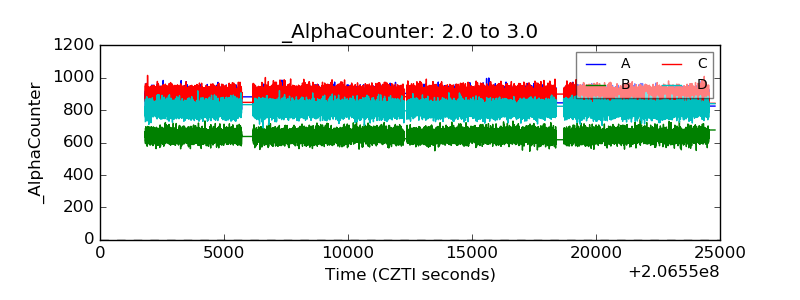 |
| _CPM_Rate |  |
| CZT Counter |  |
| +2.5 Volts monitor |  |
| +5 Volts monitor |  |
| _ROLL_ROT |  |
| _Roll_DEC | 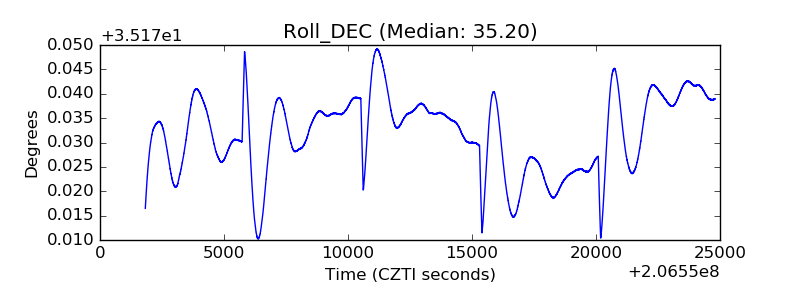 |
| _Roll_RA |  |
| Veto Counter | 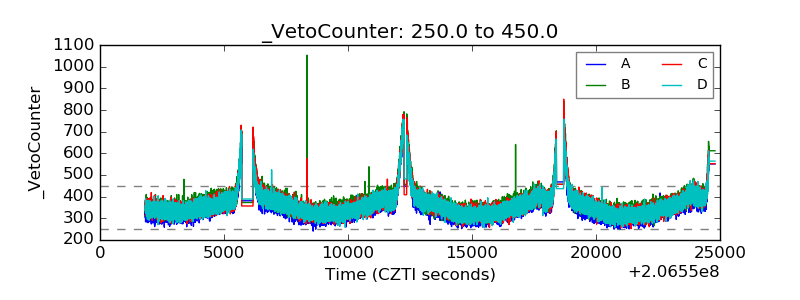 |