| Param | Original file | Final file |
|---|---|---|
| Filename | modeM0/AS1G05_219T01_9000000540cztM0_level2_bc.evt | modeM0/AS1G05_219T01_9000000540cztM0_level2_quad_clean.evt |
| Size (bytes) | 19,410,966,720 | 3,667,893,120 |
| Size | 18.1 GB | 3.4 GB |
| Events in quadrant A | 76,207,984 | 24,664,503 |
| Events in quadrant B | 323,761,988 | 17,773,176 |
| Events in quadrant C | 78,953,091 | 23,846,249 |
| Events in quadrant D | 87,736,131 | 23,408,835 |
| Mode SS | |||
|---|---|---|---|
| Quadrant | BADHDUFLAG | Total packets | Discarded packets |
| A | 0 | 6362 | 0 |
| B | 0 | 6362 | 0 |
| C | 0 | 6364 | 0 |
| D | 0 | 6362 | 0 |
| Mode M9 | |||
|---|---|---|---|
| Quadrant | BADHDUFLAG | Total packets | Discarded packets |
| A | 0 | 494 | 0 |
| B | 0 | 494 | 0 |
| C | 0 | 493 | 0 |
| D | 0 | 494 | 0 |
| Mode M0 | |||
|---|---|---|---|
| Quadrant | BADHDUFLAG | Total packets | Discarded packets |
| A | 0 | 702497 | 0 |
| B | 0 | 1524864 | 0 |
| C | 0 | 735706 | 0 |
| D | 0 | 730882 | 0 |
| Quadrant | Total seconds | Saturated seconds | Saturation percentage |
|---|---|---|---|
| A | 312062 | 6813 | 2.183220% |
| B | 311589 | 124600 | 39.988575% |
| C | 312076 | 12623 | 4.044848% |
| D | 311882 | 8522 | 2.732444% |
Noise dominated data is calculated using 1-second bins in cleaned event files. If a bin has >2000 counts, and if more than 50% of those come from <1% of pixels, then it is considered to be noise-dominated and hence unusable.
| Quadrant | # 1 sec bins | Bins with >0 counts | Bins with >2000 counts | High rate bins dominated by noise | Noise dominated (total time) | Noise dominated (detector-on time) | Marked lightcurve |
|---|---|---|---|---|---|---|---|
| A | 363927 | 312733 | 310 | 310 | 0.09% | 0.10% | 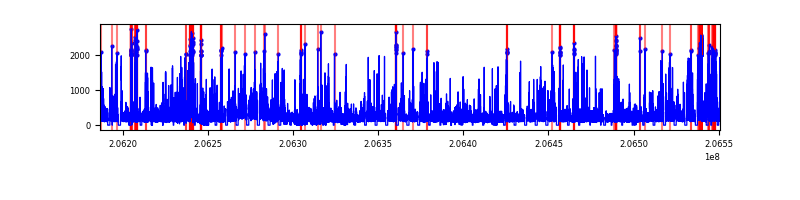 |
| B | 363927 | 312233 | 71992 | 71992 | 19.78% | 23.06% |  |
| C | 363926 | 312730 | 382 | 382 | 0.10% | 0.12% | 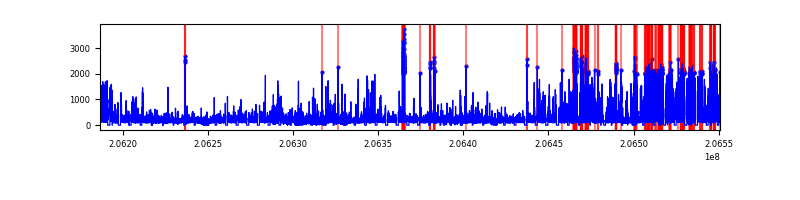 |
| D | 363927 | 312643 | 952 | 952 | 0.26% | 0.30% |  |
Top three noisy pixels from each quadrant. If the there are fewer than three noisy pixels in the level2.evt file, extra rows are filled as -1
| Pixel properties | Quadrant properties | ||||||
|---|---|---|---|---|---|---|---|
| Quadrant | DetID | PixID | Counts | Sigma | Mean | Median | Sigma |
| A | 13 | 251 | 7054817 | 2066.35 | 15326 | 14976 | 3406.9 |
| A | 0 | 13 | 2707982 | 790.46 | 15326 | 14976 | 3406.9 |
| A | 15 | 234 | 2609950 | 761.68 | 15326 | 14976 | 3406.9 |
| B | 3 | 0 | 264093804 | 114359.02 | 11953 | 11588 | 2309.2 |
| B | 14 | 167 | 4648339 | 2007.91 | 11953 | 11588 | 2309.2 |
| B | 15 | 204 | 2761441 | 1190.81 | 11953 | 11588 | 2309.2 |
| C | 9 | 247 | 16755333 | 5162.2 | 14628 | 14358 | 3243.0 |
| C | 9 | 144 | 2176032 | 666.57 | 14628 | 14358 | 3243.0 |
| C | 9 | 16 | 1595989 | 487.71 | 14628 | 14358 | 3243.0 |
| D | 13 | 53 | 7377845 | 2083.16 | 15021 | 14412 | 3534.7 |
| D | 2 | 63 | 4840640 | 1365.37 | 15021 | 14412 | 3534.7 |
| D | 2 | 136 | 4284104 | 1207.92 | 15021 | 14412 | 3534.7 |
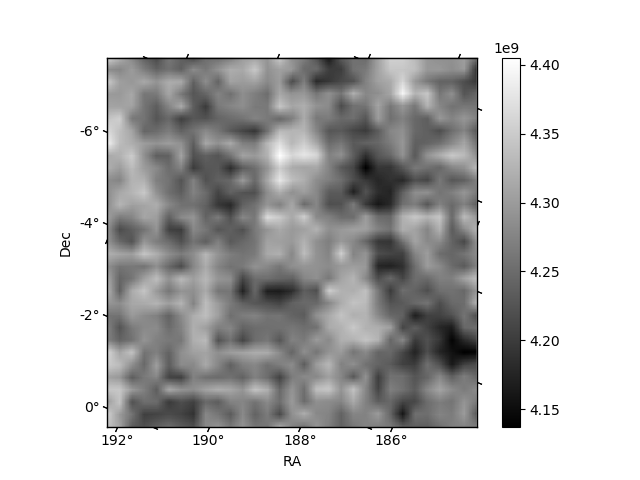
Histogram calculated using DETX and DETY for each event in the final _common_clean file
| Quadrant A |  |
 |
Quadrant B |
|---|---|---|---|
| Quadrant D |  |
 |
Quadrant C |
| Plot type | Count rate plots | Images |
|---|---|---|
| Comparison with Poisson distribution Blue bars denote a histogram of data divided into 1 sec bins. Red curve is a Poisson curve with rate = median count rate of data. |
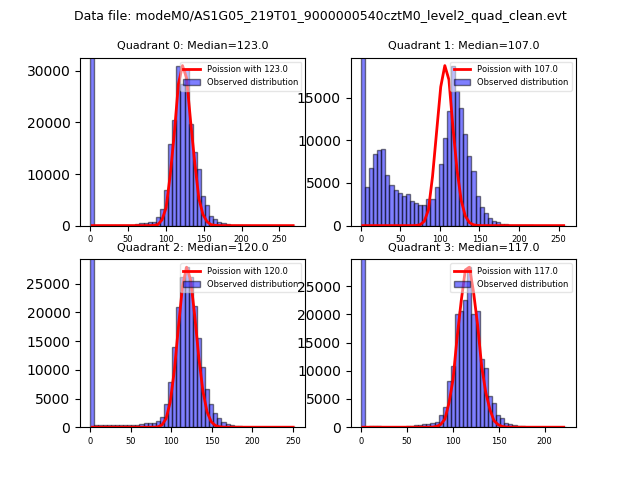 |
 |
| Quadrant-wise count rates Data is divided into 100 sec bins |
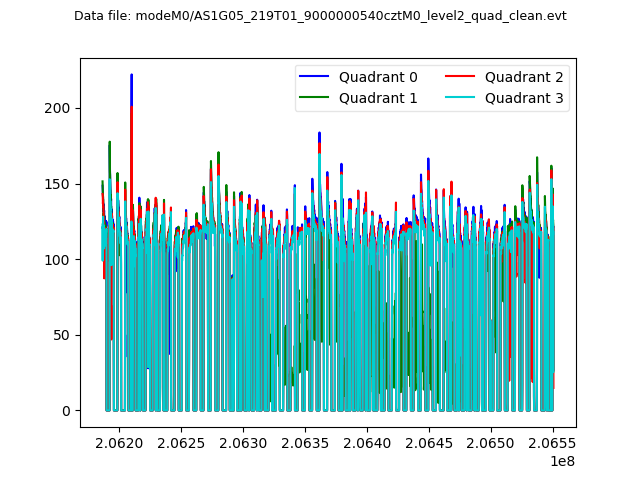 |
|
| Module-wise count rates for Quadrant A Data is divided into 100 sec bins |
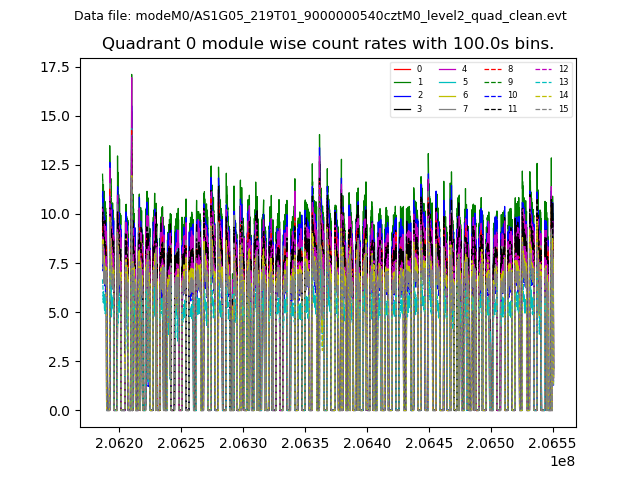 |
 |
| Module-wise count rates for Quadrant B Data is divided into 100 sec bins |
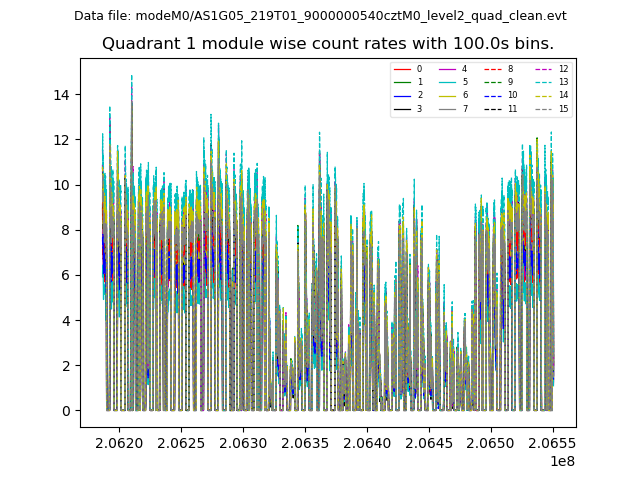 |
 |
| Module-wise count rates for Quadrant C Data is divided into 100 sec bins |
 |
 |
| Module-wise count rates for Quadrant D Data is divided into 100 sec bins |
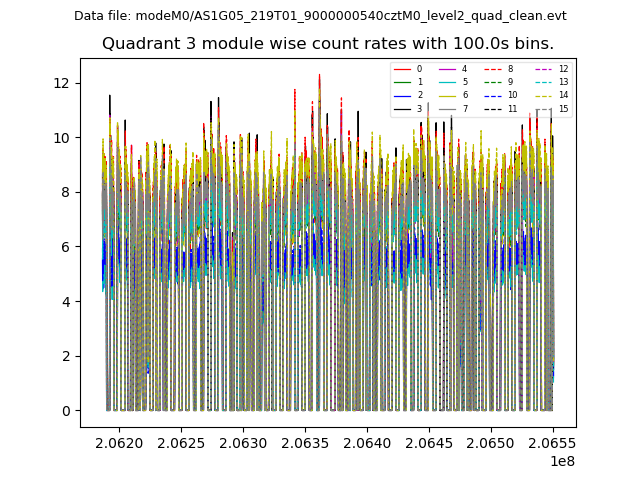 |
 |
| Parameter | Plot |
|---|---|
| CZT HV Monitor | 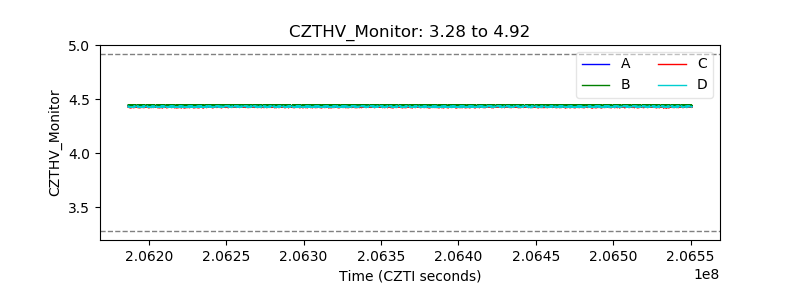 |
| D_VDD | 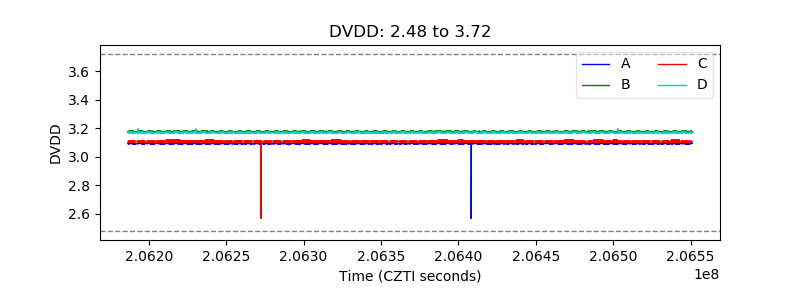 |
| Temperature 1 |  |
| Veto HV Monitor |  |
| Veto LLD |  |
| Alpha Counter | 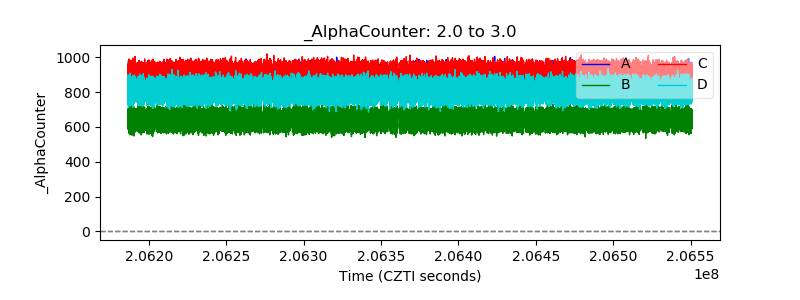 |
| _CPM_Rate |  |
| CZT Counter |  |
| +2.5 Volts monitor |  |
| +5 Volts monitor | 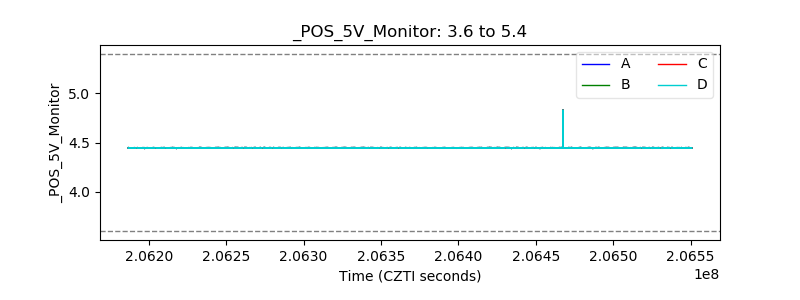 |
| _ROLL_ROT |  |
| _Roll_DEC |  |
| _Roll_RA |  |
| Veto Counter |  |