| Param | Original file | Final file |
|---|---|---|
| Filename | modeM0/AS1G05_256T01_9000000538cztM0_level2.evt | modeM0/AS1G05_256T01_9000000538cztM0_level2_quad_clean.evt |
| Size (bytes) | 5,350,127,040 | 919,437,120 |
| Size | 5.0 GB | 876.8 MB |
| Events in quadrant A | 31,450,554 | 6,296,317 |
| Events in quadrant B | 31,396,682 | 6,267,154 |
| Events in quadrant C | 49,439,460 | 5,575,789 |
| Events in quadrant D | 45,990,541 | 5,877,900 |
| Mode M9 | |||
|---|---|---|---|
| Quadrant | BADHDUFLAG | Total packets | Discarded packets |
| A | 0 | 65 | 0 |
| B | 0 | 65 | 0 |
| C | 0 | 65 | 0 |
| D | 0 | 65 | 0 |
| Mode M0 | |||
|---|---|---|---|
| Quadrant | BADHDUFLAG | Total packets | Discarded packets |
| A | 0 | 133705 | 0 |
| B | 0 | 132477 | 0 |
| C | 0 | 187577 | 0 |
| D | 0 | 177358 | 0 |
| Mode SS | |||
|---|---|---|---|
| Quadrant | BADHDUFLAG | Total packets | Discarded packets |
| A | 0 | 1136 | 0 |
| B | 0 | 1138 | 0 |
| C | 0 | 1138 | 0 |
| D | 0 | 1138 | 0 |
| Quadrant | Total seconds | Saturated seconds | Saturation percentage |
|---|---|---|---|
| A | 55747 | 2026 | 3.634276% |
| B | 55758 | 1575 | 2.824707% |
| C | 55751 | 10951 | 19.642697% |
| D | 55751 | 5836 | 10.467974% |
Noise dominated data is calculated using 1-second bins in cleaned event files. If a bin has >2000 counts, and if more than 50% of those come from <1% of pixels, then it is considered to be noise-dominated and hence unusable.
| Quadrant | # 1 sec bins | Bins with >0 counts | Bins with >2000 counts | High rate bins dominated by noise | Noise dominated (total time) | Noise dominated (detector-on time) | Marked lightcurve |
|---|---|---|---|---|---|---|---|
| A | 62516 | 55808 | 1352 | 1352 | 2.16% | 2.42% | 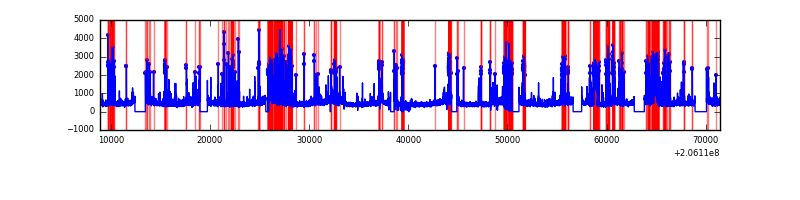 |
| B | 62516 | 55814 | 940 | 940 | 1.50% | 1.68% | 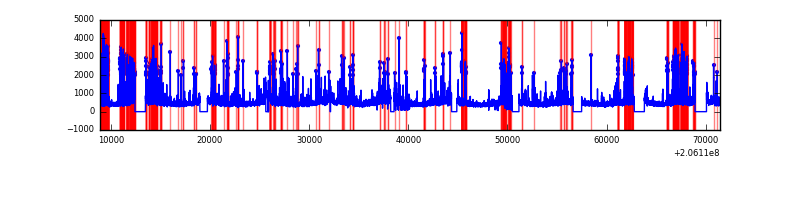 |
| C | 62515 | 55807 | 9739 | 9739 | 15.58% | 17.45% | 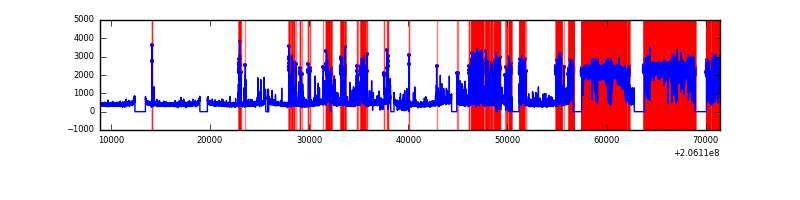 |
| D | 62516 | 55812 | 4368 | 4368 | 6.99% | 7.83% |  |
Top three noisy pixels from each quadrant. If the there are fewer than three noisy pixels in the level2.evt file, extra rows are filled as -1
| Pixel properties | Quadrant properties | ||||||
|---|---|---|---|---|---|---|---|
| Quadrant | DetID | PixID | Counts | Sigma | Mean | Median | Sigma |
| A | 0 | 199 | 4280829 | 3472.35 | 6117 | 5991 | 1231.1 |
| A | 15 | 234 | 1927166 | 1560.52 | 6117 | 5991 | 1231.1 |
| A | 0 | 226 | 475180 | 381.11 | 6117 | 5991 | 1231.1 |
| B | 14 | 167 | 4601206 | 3969.17 | 6179 | 6030 | 1157.7 |
| B | 10 | 16 | 1307621 | 1124.27 | 6179 | 6030 | 1157.7 |
| B | 4 | 48 | 291406 | 246.5 | 6179 | 6030 | 1157.7 |
| C | 9 | 144 | 27374238 | 21900.38 | 5449 | 5456 | 1249.7 |
| C | 9 | 247 | 619374 | 491.25 | 5449 | 5456 | 1249.7 |
| C | 10 | 65 | 70199 | 51.81 | 5449 | 5456 | 1249.7 |
| D | 2 | 232 | 18055144 | 13144.08 | 5781 | 5613 | 1373.2 |
| D | 13 | 53 | 1175765 | 852.13 | 5781 | 5613 | 1373.2 |
| D | 2 | 136 | 934925 | 676.75 | 5781 | 5613 | 1373.2 |
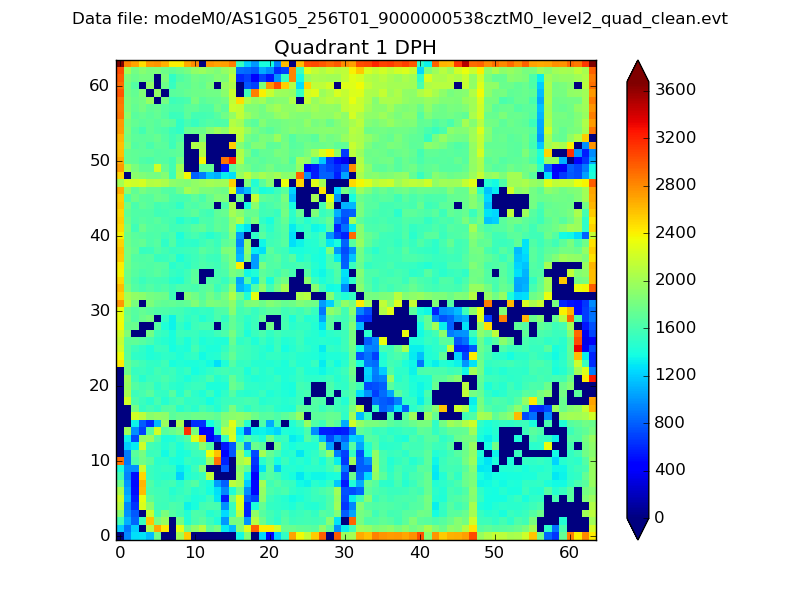
Histogram calculated using DETX and DETY for each event in the final _common_clean file
| Quadrant A |  |
 |
Quadrant B |
|---|---|---|---|
| Quadrant D | 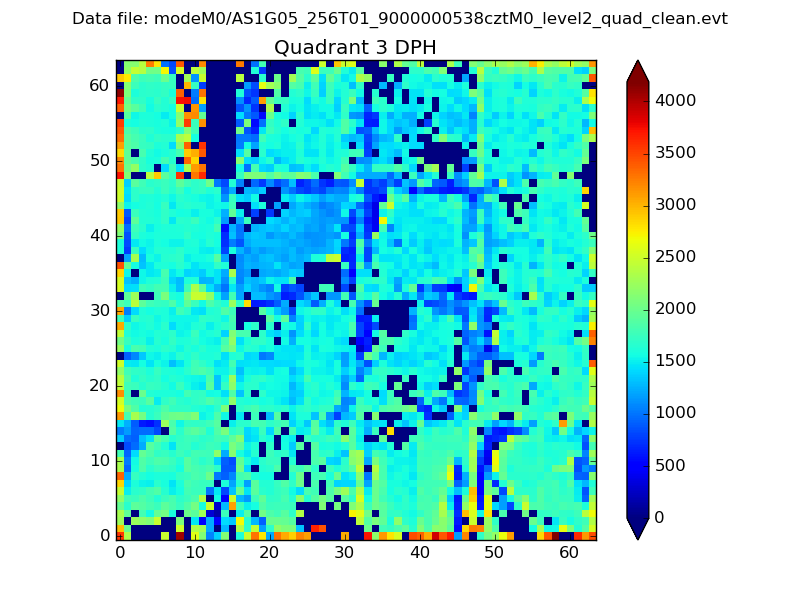 |
 |
Quadrant C |
| Plot type | Count rate plots | Images |
|---|---|---|
| Comparison with Poisson distribution Blue bars denote a histogram of data divided into 1 sec bins. Red curve is a Poisson curve with rate = median count rate of data. |
 |
 |
| Quadrant-wise count rates Data is divided into 100 sec bins |
 |
|
| Module-wise count rates for Quadrant A Data is divided into 100 sec bins |
 |
 |
| Module-wise count rates for Quadrant B Data is divided into 100 sec bins |
 |
 |
| Module-wise count rates for Quadrant C Data is divided into 100 sec bins |
 |
 |
| Module-wise count rates for Quadrant D Data is divided into 100 sec bins |
 |
 |
| Parameter | Plot |
|---|---|
| CZT HV Monitor |  |
| D_VDD |  |
| Temperature 1 |  |
| Veto HV Monitor |  |
| Veto LLD |  |
| Alpha Counter | 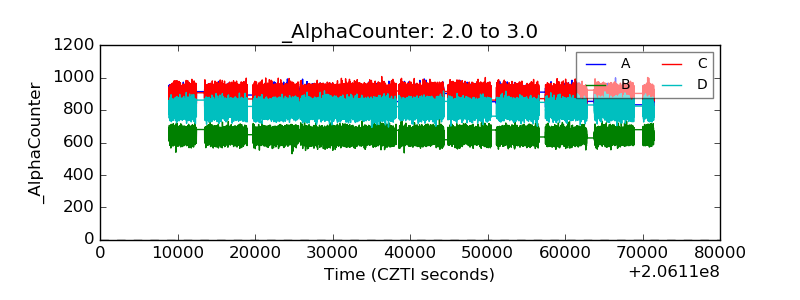 |
| _CPM_Rate |  |
| CZT Counter |  |
| +2.5 Volts monitor |  |
| +5 Volts monitor | 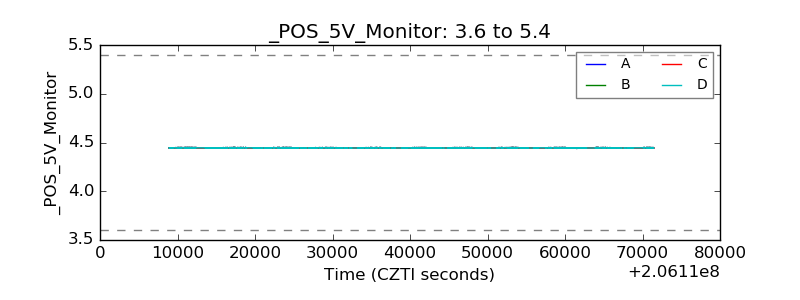 |
| _ROLL_ROT | 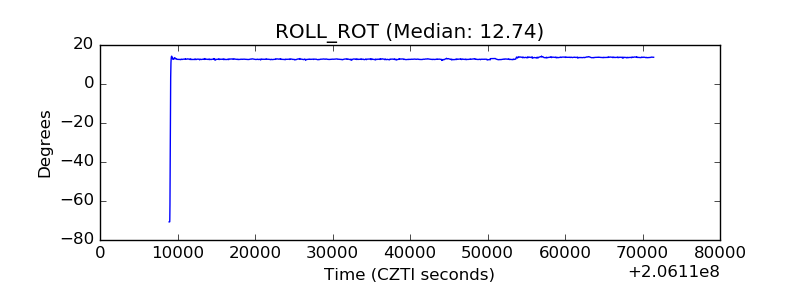 |
| _Roll_DEC |  |
| _Roll_RA | 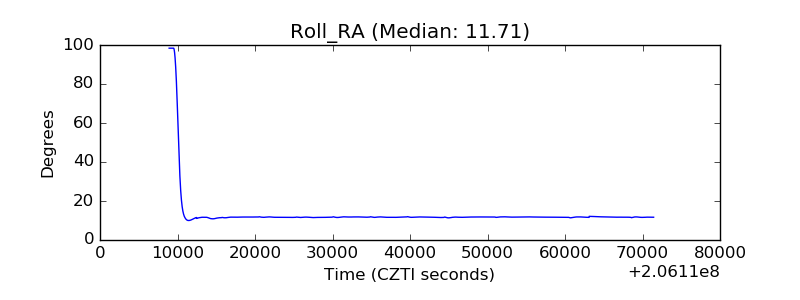 |
| Veto Counter |  |