| Param | Original file | Final file |
|---|---|---|
| Filename | modeM0/AS1G05_245T01_9000000532cztM0_level2_bc.evt | modeM0/AS1G05_245T01_9000000532cztM0_level2_quad_clean.evt |
| Size (bytes) | 371,367,360 | 160,364,160 |
| Size | 354.2 MB | 152.9 MB |
| Events in quadrant A | 2,517,145 | 1,044,795 |
| Events in quadrant B | 2,695,477 | 1,043,257 |
| Events in quadrant C | 2,348,194 | 1,025,334 |
| Events in quadrant D | 2,929,439 | 982,883 |
| Mode M9 | |||
|---|---|---|---|
| Quadrant | BADHDUFLAG | Total packets | Discarded packets |
| A | 0 | 23 | 0 |
| B | 0 | 23 | 0 |
| C | 0 | 23 | 0 |
| D | 0 | 23 | 0 |
| Mode SS | |||
|---|---|---|---|
| Quadrant | BADHDUFLAG | Total packets | Discarded packets |
| A | 0 | 222 | 0 |
| B | 0 | 222 | 0 |
| C | 0 | 222 | 0 |
| D | 0 | 222 | 0 |
| Mode M0 | |||
|---|---|---|---|
| Quadrant | BADHDUFLAG | Total packets | Discarded packets |
| A | 0 | 23092 | 0 |
| B | 0 | 23680 | 0 |
| C | 0 | 22621 | 0 |
| D | 0 | 24914 | 0 |
| Quadrant | Total seconds | Saturated seconds | Saturation percentage |
|---|---|---|---|
| A | 11001 | 146 | 1.327152% |
| B | 11001 | 158 | 1.436233% |
| C | 11001 | 128 | 1.163531% |
| D | 11001 | 269 | 2.445232% |
Noise dominated data is calculated using 1-second bins in cleaned event files. If a bin has >2000 counts, and if more than 50% of those come from <1% of pixels, then it is considered to be noise-dominated and hence unusable.
| Quadrant | # 1 sec bins | Bins with >0 counts | Bins with >2000 counts | High rate bins dominated by noise | Noise dominated (total time) | Noise dominated (detector-on time) | Marked lightcurve |
|---|---|---|---|---|---|---|---|
| A | 13211 | 11002 | 0 | 0 | 0.00% | 0.00% |  |
| B | 13211 | 11001 | 0 | 0 | 0.00% | 0.00% |  |
| C | 13211 | 11001 | 0 | 0 | 0.00% | 0.00% |  |
| D | 13211 | 11001 | 6 | 6 | 0.05% | 0.05% |  |
Top three noisy pixels from each quadrant. If the there are fewer than three noisy pixels in the level2.evt file, extra rows are filled as -1
| Pixel properties | Quadrant properties | ||||||
|---|---|---|---|---|---|---|---|
| Quadrant | DetID | PixID | Counts | Sigma | Mean | Median | Sigma |
| A | 0 | 118 | 47898 | 338.03 | 610 | 597 | 139.9 |
| A | 13 | 14 | 39061 | 274.88 | 610 | 597 | 139.9 |
| A | 15 | 234 | 29847 | 209.03 | 610 | 597 | 139.9 |
| B | 15 | 204 | 90191 | 742.63 | 613 | 603 | 120.6 |
| B | 10 | 16 | 62501 | 513.09 | 613 | 603 | 120.6 |
| B | 5 | 184 | 48915 | 400.47 | 613 | 603 | 120.6 |
| C | 10 | 65 | 13325 | 93.37 | 596 | 591 | 136.4 |
| C | 13 | 61 | 4081 | 25.59 | 596 | 591 | 136.4 |
| C | 7 | 247 | 1865 | 9.34 | 596 | 591 | 136.4 |
| D | 1 | 52 | 179281 | 1270.99 | 594 | 573 | 140.6 |
| D | 10 | 172 | 167386 | 1186.39 | 594 | 573 | 140.6 |
| D | 13 | 239 | 89389 | 631.67 | 594 | 573 | 140.6 |
Histogram calculated using DETX and DETY for each event in the final _common_clean file
| Quadrant A | 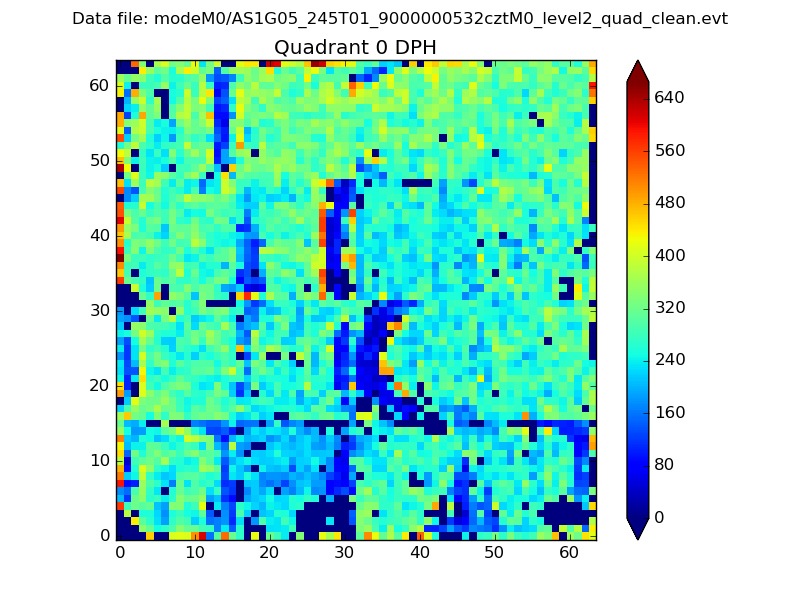 |
 |
Quadrant B |
|---|---|---|---|
| Quadrant D |  |
 |
Quadrant C |
| Plot type | Count rate plots | Images |
|---|---|---|
| Comparison with Poisson distribution Blue bars denote a histogram of data divided into 1 sec bins. Red curve is a Poisson curve with rate = median count rate of data. |
 |
 |
| Quadrant-wise count rates Data is divided into 100 sec bins |
 |
|
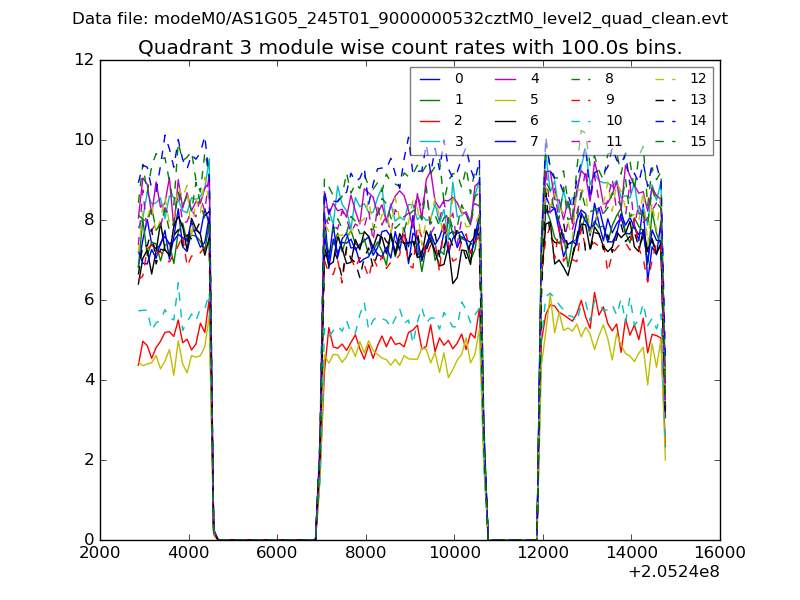
| Module-wise count rates for Quadrant A Data is divided into 100 sec bins |
 |
 |
| Module-wise count rates for Quadrant B Data is divided into 100 sec bins |
 |
 |
| Module-wise count rates for Quadrant C Data is divided into 100 sec bins |
 |
 |
| Module-wise count rates for Quadrant D Data is divided into 100 sec bins |
 |
 |
| Parameter | Plot |
|---|---|
| CZT HV Monitor |  |
| D_VDD |  |
| Temperature 1 |  |
| Veto HV Monitor | 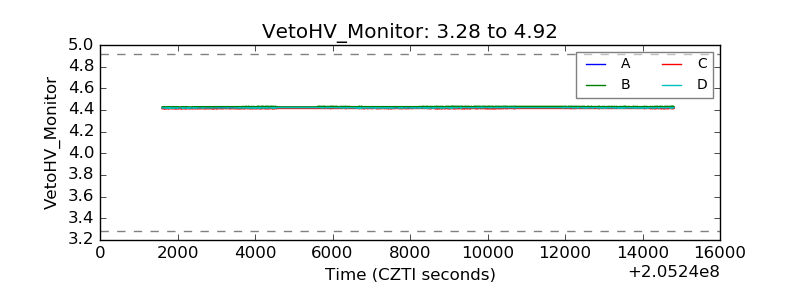 |
| Veto LLD |  |
| Alpha Counter | 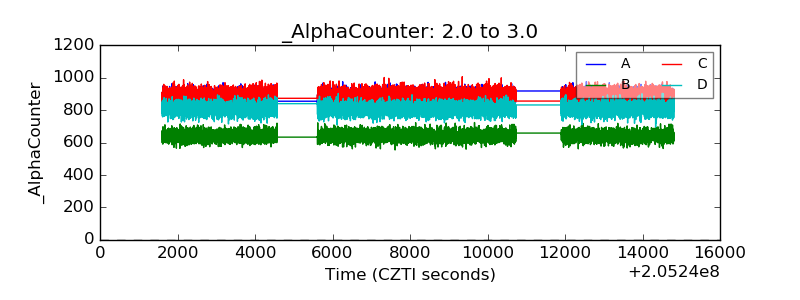 |
| _CPM_Rate |  |
| CZT Counter | 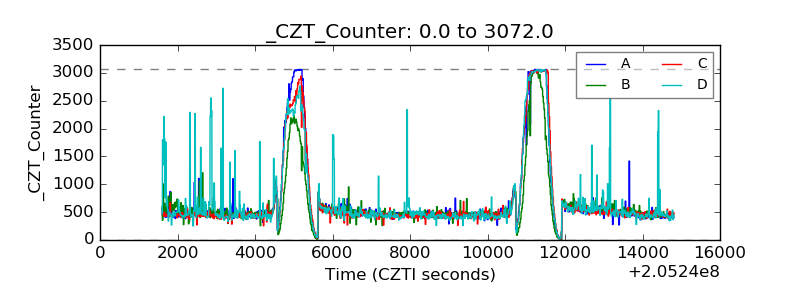 |
| +2.5 Volts monitor |  |
| +5 Volts monitor | 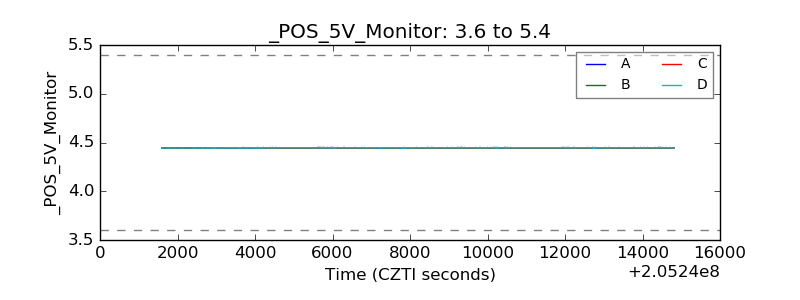 |
| _ROLL_ROT |  |
| _Roll_DEC |  |
| _Roll_RA |  |
| Veto Counter |  |