| Param | Original file | Final file |
|---|---|---|
| Filename | modeM0/AS1G05_213T01_9000000534cztM0_level2_bc.evt | modeM0/AS1G05_213T01_9000000534cztM0_level2_quad_clean.evt |
| Size (bytes) | 249,920,640 | 94,006,080 |
| Size | 238.3 MB | 89.7 MB |
| Events in quadrant A | 1,503,996 | 604,388 |
| Events in quadrant B | 1,601,629 | 611,152 |
| Events in quadrant C | 1,387,985 | 594,674 |
| Events in quadrant D | 2,601,636 | 559,948 |
| Mode M9 | |||
|---|---|---|---|
| Quadrant | BADHDUFLAG | Total packets | Discarded packets |
| A | 0 | 26 | 0 |
| B | 0 | 26 | 0 |
| C | 0 | 26 | 0 |
| D | 0 | 26 | 0 |
| Mode SS | |||
|---|---|---|---|
| Quadrant | BADHDUFLAG | Total packets | Discarded packets |
| A | 0 | 142 | 0 |
| B | 0 | 142 | 0 |
| C | 0 | 142 | 0 |
| D | 0 | 142 | 0 |
| Mode M0 | |||
|---|---|---|---|
| Quadrant | BADHDUFLAG | Total packets | Discarded packets |
| A | 0 | 14475 | 0 |
| B | 0 | 14659 | 0 |
| C | 0 | 14031 | 0 |
| D | 0 | 18827 | 0 |
| Quadrant | Total seconds | Saturated seconds | Saturation percentage |
|---|---|---|---|
| A | 6837 | 67 | 0.979962% |
| B | 6837 | 39 | 0.570426% |
| C | 6837 | 18 | 0.263273% |
| D | 6837 | 334 | 4.885184% |
Noise dominated data is calculated using 1-second bins in cleaned event files. If a bin has >2000 counts, and if more than 50% of those come from <1% of pixels, then it is considered to be noise-dominated and hence unusable.
| Quadrant | # 1 sec bins | Bins with >0 counts | Bins with >2000 counts | High rate bins dominated by noise | Noise dominated (total time) | Noise dominated (detector-on time) | Marked lightcurve |
|---|---|---|---|---|---|---|---|
| A | 9447 | 6836 | 0 | 0 | 0.00% | 0.00% |  |
| B | 9447 | 6837 | 0 | 0 | 0.00% | 0.00% |  |
| C | 9447 | 6836 | 0 | 0 | 0.00% | 0.00% |  |
| D | 9447 | 6837 | 3 | 3 | 0.03% | 0.04% |  |
Top three noisy pixels from each quadrant. If the there are fewer than three noisy pixels in the level2.evt file, extra rows are filled as -1
| Pixel properties | Quadrant properties | ||||||
|---|---|---|---|---|---|---|---|
| Quadrant | DetID | PixID | Counts | Sigma | Mean | Median | Sigma |
| A | 0 | 118 | 47752 | 584.9 | 361 | 354 | 81.0 |
| A | 13 | 14 | 30642 | 373.76 | 361 | 354 | 81.0 |
| A | 15 | 234 | 23008 | 279.55 | 361 | 354 | 81.0 |
| B | 10 | 16 | 54152 | 753.14 | 365 | 356 | 71.4 |
| B | 0 | 183 | 33141 | 458.99 | 365 | 356 | 71.4 |
| B | 14 | 167 | 30423 | 420.93 | 365 | 356 | 71.4 |
| C | 10 | 65 | 15875 | 198.69 | 348 | 343 | 78.2 |
| C | 1 | 16 | 5775 | 69.49 | 348 | 343 | 78.2 |
| C | 13 | 61 | 2419 | 26.56 | 348 | 343 | 78.2 |
| D | 1 | 52 | 1046077 | 12618.03 | 346 | 334 | 82.9 |
| D | 2 | 232 | 76949 | 924.44 | 346 | 334 | 82.9 |
| D | 13 | 137 | 31421 | 375.1 | 346 | 334 | 82.9 |
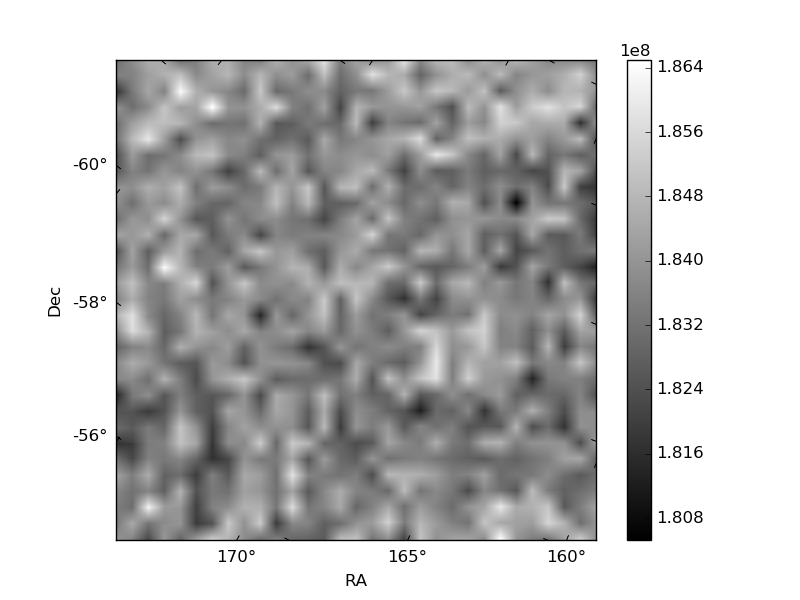
Histogram calculated using DETX and DETY for each event in the final _common_clean file
| Quadrant A |  |
 |
Quadrant B |
|---|---|---|---|
| Quadrant D |  |
 |
Quadrant C |
| Plot type | Count rate plots | Images |
|---|---|---|
| Comparison with Poisson distribution Blue bars denote a histogram of data divided into 1 sec bins. Red curve is a Poisson curve with rate = median count rate of data. |
 |
 |
| Quadrant-wise count rates Data is divided into 100 sec bins |
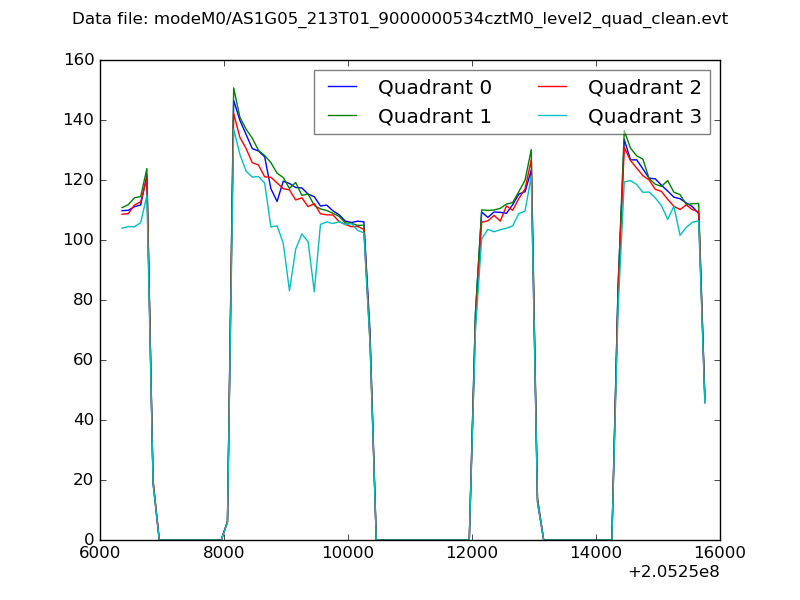 |
|
| Module-wise count rates for Quadrant A Data is divided into 100 sec bins |
 |
 |
| Module-wise count rates for Quadrant B Data is divided into 100 sec bins |
 |
 |
| Module-wise count rates for Quadrant C Data is divided into 100 sec bins |
 |
 |
| Module-wise count rates for Quadrant D Data is divided into 100 sec bins |
 |
 |
| Parameter | Plot |
|---|---|
| CZT HV Monitor |  |
| D_VDD |  |
| Temperature 1 |  |
| Veto HV Monitor |  |
| Veto LLD |  |
| Alpha Counter | 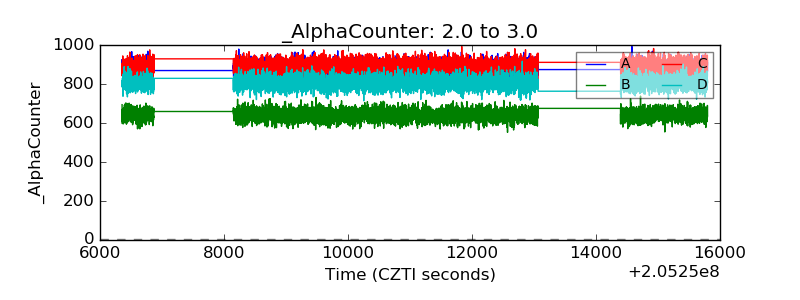 |
| _CPM_Rate |  |
| CZT Counter |  |
| +2.5 Volts monitor |  |
| +5 Volts monitor |  |
| _ROLL_ROT | 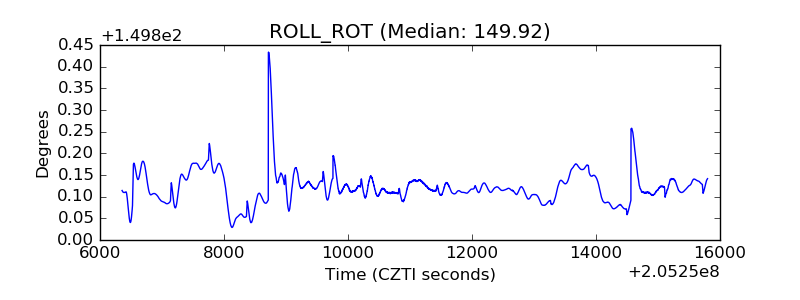 |
| _Roll_DEC |  |
| _Roll_RA |  |
| Veto Counter | 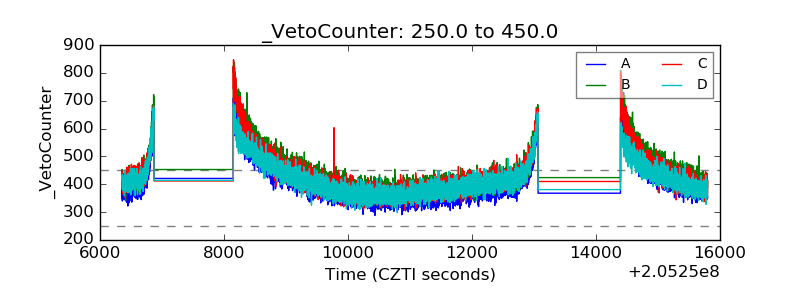 |