| Param | Original file | Final file |
|---|---|---|
| Filename | modeM0/AS1G05_195T01_9000000530cztM0_level2_bc.evt | modeM0/AS1G05_195T01_9000000530cztM0_level2_quad_clean.evt |
| Size (bytes) | 2,967,497,280 | 836,991,360 |
| Size | 2.8 GB | 798.2 MB |
| Events in quadrant A | 17,298,010 | 5,291,485 |
| Events in quadrant B | 22,251,215 | 5,210,986 |
| Events in quadrant C | 13,744,233 | 5,234,165 |
| Events in quadrant D | 31,906,716 | 4,911,157 |
| Mode SS | |||
|---|---|---|---|
| Quadrant | BADHDUFLAG | Total packets | Discarded packets |
| A | 0 | 1402 | 0 |
| B | 0 | 1400 | 0 |
| C | 0 | 1394 | 0 |
| D | 0 | 1398 | 0 |
| Mode M9 | |||
|---|---|---|---|
| Quadrant | BADHDUFLAG | Total packets | Discarded packets |
| A | 0 | 105 | 0 |
| B | 0 | 104 | 0 |
| C | 0 | 103 | 0 |
| D | 0 | 107 | 0 |
| Mode M0 | |||
|---|---|---|---|
| Quadrant | BADHDUFLAG | Total packets | Discarded packets |
| A | 0 | 155318 | 0 |
| B | 0 | 169713 | 0 |
| C | 0 | 144070 | 0 |
| D | 0 | 198015 | 0 |
| Quadrant | Total seconds | Saturated seconds | Saturation percentage |
|---|---|---|---|
| A | 68502 | 1663 | 2.427666% |
| B | 68498 | 3221 | 4.702327% |
| C | 68540 | 803 | 1.171579% |
| D | 68497 | 8297 | 12.112939% |
Noise dominated data is calculated using 1-second bins in cleaned event files. If a bin has >2000 counts, and if more than 50% of those come from <1% of pixels, then it is considered to be noise-dominated and hence unusable.
| Quadrant | # 1 sec bins | Bins with >0 counts | Bins with >2000 counts | High rate bins dominated by noise | Noise dominated (total time) | Noise dominated (detector-on time) | Marked lightcurve |
|---|---|---|---|---|---|---|---|
| A | 80939 | 68710 | 35 | 35 | 0.04% | 0.05% | 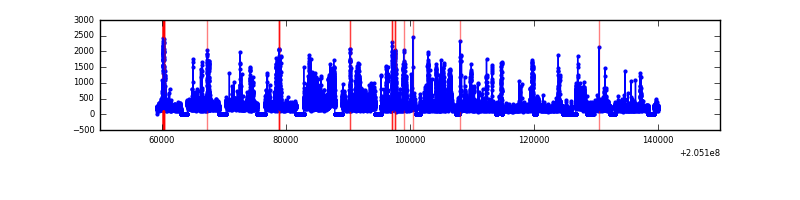 |
| B | 80939 | 68678 | 970 | 970 | 1.20% | 1.41% |  |
| C | 80938 | 68744 | 6 | 6 | 0.01% | 0.01% |  |
| D | 80939 | 68680 | 5171 | 5171 | 6.39% | 7.53% |  |
Top three noisy pixels from each quadrant. If the there are fewer than three noisy pixels in the level2.evt file, extra rows are filled as -1
| Pixel properties | Quadrant properties | ||||||
|---|---|---|---|---|---|---|---|
| Quadrant | DetID | PixID | Counts | Sigma | Mean | Median | Sigma |
| A | 0 | 50 | 1861671 | 2542.97 | 3264 | 3197 | 730.8 |
| A | 0 | 199 | 1478547 | 2018.74 | 3264 | 3197 | 730.8 |
| A | 8 | 15 | 332394 | 450.44 | 3264 | 3197 | 730.8 |
| B | 10 | 16 | 5236136 | 8326.66 | 3244 | 3150 | 628.5 |
| B | 15 | 204 | 2060136 | 3273.05 | 3244 | 3150 | 628.5 |
| B | 4 | 48 | 550083 | 870.27 | 3244 | 3150 | 628.5 |
| C | 9 | 144 | 1073209 | 1488.09 | 3196 | 3140 | 719.1 |
| C | 10 | 65 | 66198 | 87.69 | 3196 | 3140 | 719.1 |
| C | 12 | 4 | 30733 | 38.37 | 3196 | 3140 | 719.1 |
| D | 2 | 37 | 13049839 | 17561.72 | 3110 | 2986 | 742.9 |
| D | 13 | 53 | 3039098 | 4086.76 | 3110 | 2986 | 742.9 |
| D | 4 | 95 | 795179 | 1066.33 | 3110 | 2986 | 742.9 |
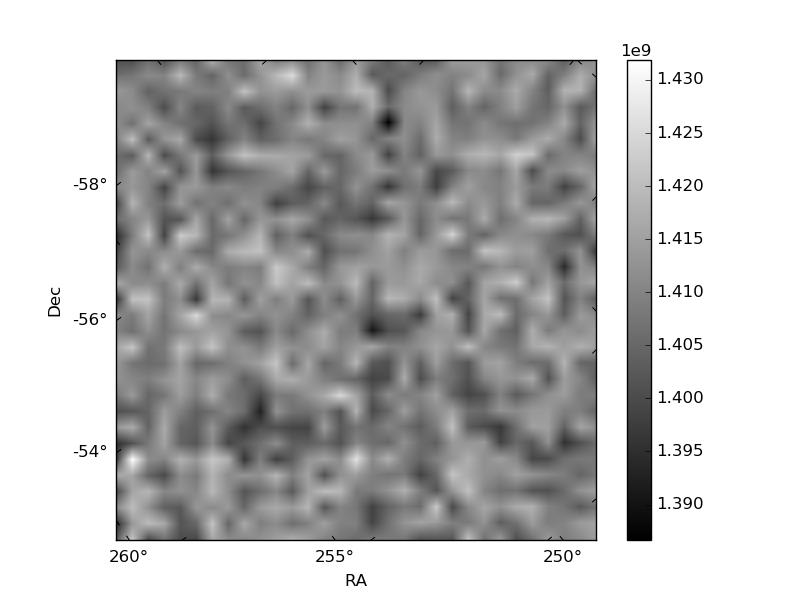
Histogram calculated using DETX and DETY for each event in the final _common_clean file
| Quadrant A |  |
 |
Quadrant B |
|---|---|---|---|
| Quadrant D |  |
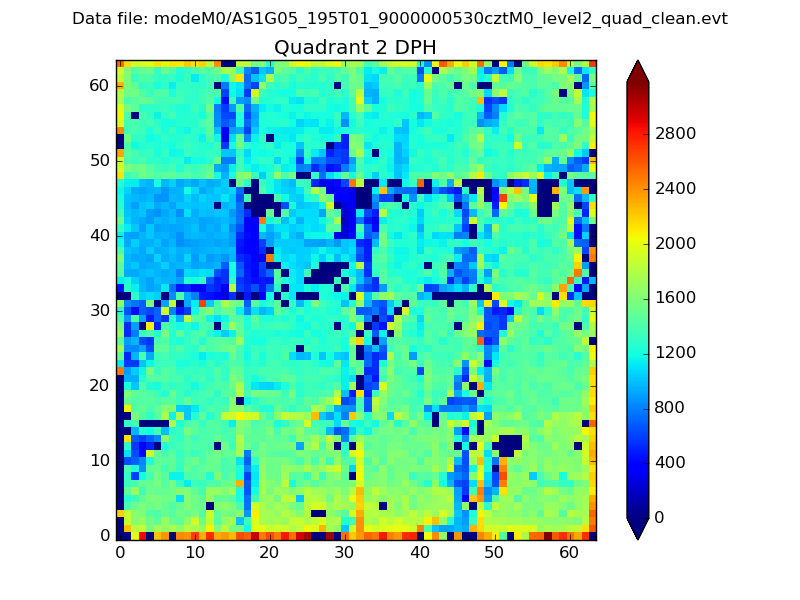 |
Quadrant C |
| Plot type | Count rate plots | Images |
|---|---|---|
| Comparison with Poisson distribution Blue bars denote a histogram of data divided into 1 sec bins. Red curve is a Poisson curve with rate = median count rate of data. |
 |
 |
| Quadrant-wise count rates Data is divided into 100 sec bins |
 |
|
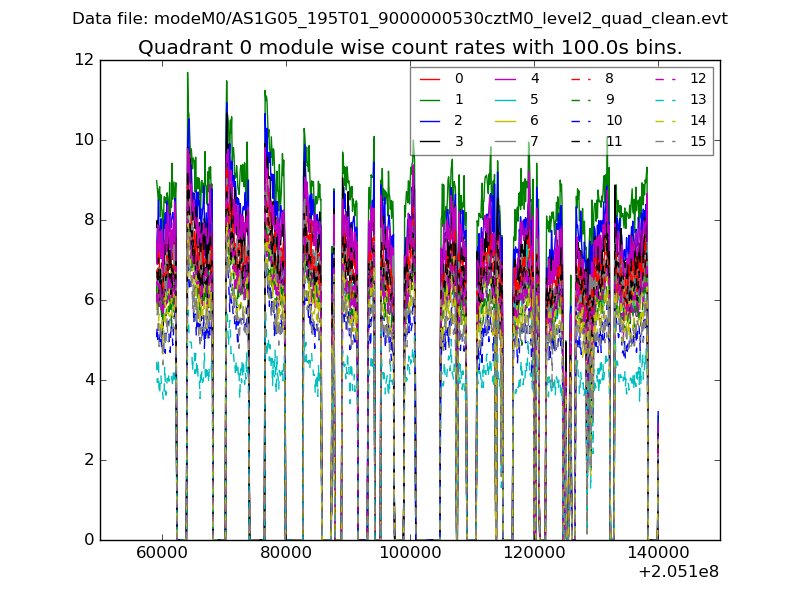
| Module-wise count rates for Quadrant A Data is divided into 100 sec bins |
 |
 |
| Module-wise count rates for Quadrant B Data is divided into 100 sec bins |
 |
 |
| Module-wise count rates for Quadrant C Data is divided into 100 sec bins |
 |
 |
| Module-wise count rates for Quadrant D Data is divided into 100 sec bins |
 |
 |
| Parameter | Plot |
|---|---|
| CZT HV Monitor |  |
| D_VDD |  |
| Temperature 1 |  |
| Veto HV Monitor |  |
| Veto LLD |  |
| Alpha Counter | 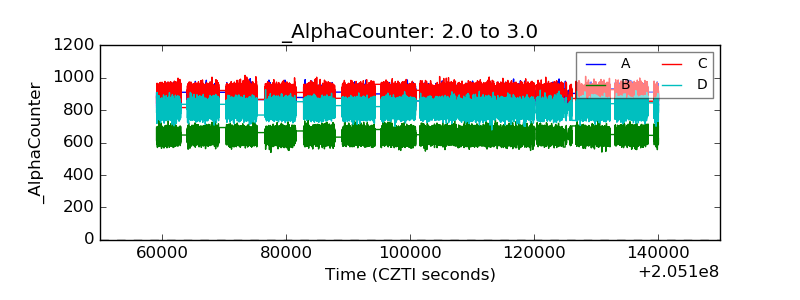 |
| _CPM_Rate | 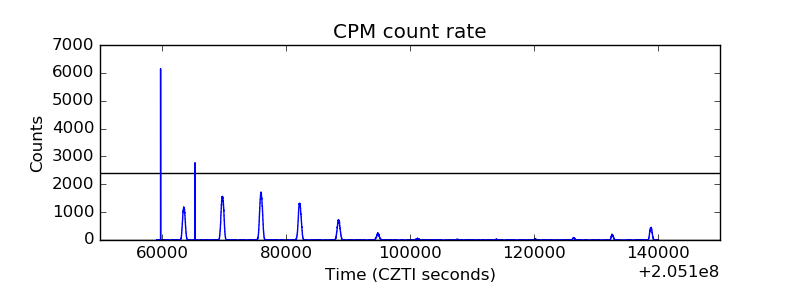 |
| CZT Counter | 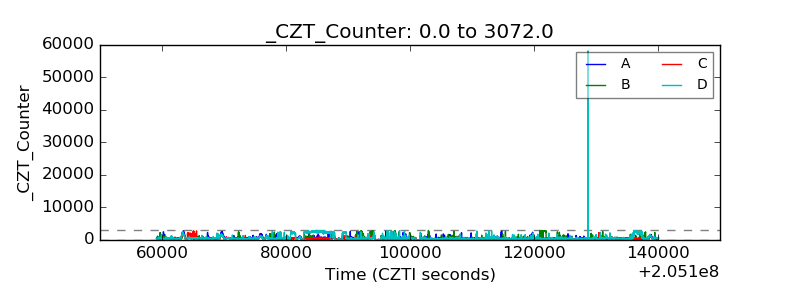 |
| +2.5 Volts monitor |  |
| +5 Volts monitor |  |
| _ROLL_ROT |  |
| _Roll_DEC |  |
| _Roll_RA |  |
| Veto Counter |  |