| Param | Original file | Final file |
|---|---|---|
| Filename | modeM0/AS1G05_167T01_9000000528cztM0_level2_bc.evt | modeM0/AS1G05_167T01_9000000528cztM0_level2_quad_clean.evt |
| Size (bytes) | 1,220,840,640 | 442,581,120 |
| Size | 1.1 GB | 422.1 MB |
| Events in quadrant A | 9,068,442 | 2,733,303 |
| Events in quadrant B | 8,359,287 | 2,732,699 |
| Events in quadrant C | 7,573,438 | 2,714,300 |
| Events in quadrant D | 9,374,627 | 2,612,530 |
| Mode M9 | |||
|---|---|---|---|
| Quadrant | BADHDUFLAG | Total packets | Discarded packets |
| A | 0 | 33 | 0 |
| B | 0 | 33 | 0 |
| C | 0 | 33 | 0 |
| D | 0 | 33 | 0 |
| Mode SS | |||
|---|---|---|---|
| Quadrant | BADHDUFLAG | Total packets | Discarded packets |
| A | 0 | 772 | 0 |
| B | 0 | 772 | 0 |
| C | 0 | 772 | 0 |
| D | 0 | 774 | 0 |
| Mode M0 | |||
|---|---|---|---|
| Quadrant | BADHDUFLAG | Total packets | Discarded packets |
| A | 0 | 83776 | 0 |
| B | 0 | 80010 | 0 |
| C | 0 | 78869 | 0 |
| D | 0 | 84450 | 0 |
| Quadrant | Total seconds | Saturated seconds | Saturation percentage |
|---|---|---|---|
| A | 38033 | 778 | 2.045592% |
| B | 38034 | 766 | 2.013987% |
| C | 38032 | 491 | 1.291018% |
| D | 38035 | 843 | 2.216380% |
Noise dominated data is calculated using 1-second bins in cleaned event files. If a bin has >2000 counts, and if more than 50% of those come from <1% of pixels, then it is considered to be noise-dominated and hence unusable.
| Quadrant | # 1 sec bins | Bins with >0 counts | Bins with >2000 counts | High rate bins dominated by noise | Noise dominated (total time) | Noise dominated (detector-on time) | Marked lightcurve |
|---|---|---|---|---|---|---|---|
| A | 40618 | 38040 | 8 | 8 | 0.02% | 0.02% | 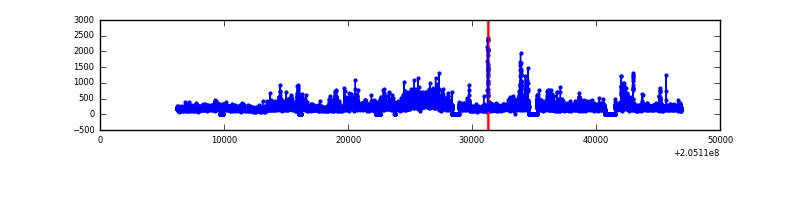 |
| B | 40618 | 38041 | 0 | 0 | 0.00% | 0.00% |  |
| C | 40618 | 38040 | 0 | 0 | 0.00% | 0.00% |  |
| D | 40618 | 38043 | 67 | 67 | 0.16% | 0.18% |  |
Top three noisy pixels from each quadrant. If the there are fewer than three noisy pixels in the level2.evt file, extra rows are filled as -1
| Pixel properties | Quadrant properties | ||||||
|---|---|---|---|---|---|---|---|
| Quadrant | DetID | PixID | Counts | Sigma | Mean | Median | Sigma |
| A | 0 | 199 | 1319223 | 3085.93 | 1873 | 1828 | 426.9 |
| A | 0 | 50 | 111838 | 257.69 | 1873 | 1828 | 426.9 |
| A | 0 | 226 | 109916 | 253.19 | 1873 | 1828 | 426.9 |
| B | 15 | 204 | 622886 | 1677.01 | 1896 | 1850 | 370.3 |
| B | 14 | 167 | 176195 | 470.79 | 1896 | 1850 | 370.3 |
| B | 7 | 252 | 82871 | 218.78 | 1896 | 1850 | 370.3 |
| C | 9 | 144 | 125694 | 298.65 | 1852 | 1833 | 414.7 |
| C | 14 | 234 | 91540 | 216.3 | 1852 | 1833 | 414.7 |
| C | 10 | 65 | 38060 | 87.35 | 1852 | 1833 | 414.7 |
| D | 13 | 239 | 640811 | 1450.74 | 1847 | 1778 | 440.5 |
| D | 2 | 37 | 594674 | 1346.0 | 1847 | 1778 | 440.5 |
| D | 13 | 46 | 462087 | 1045.0 | 1847 | 1778 | 440.5 |
Histogram calculated using DETX and DETY for each event in the final _common_clean file
| Quadrant A | 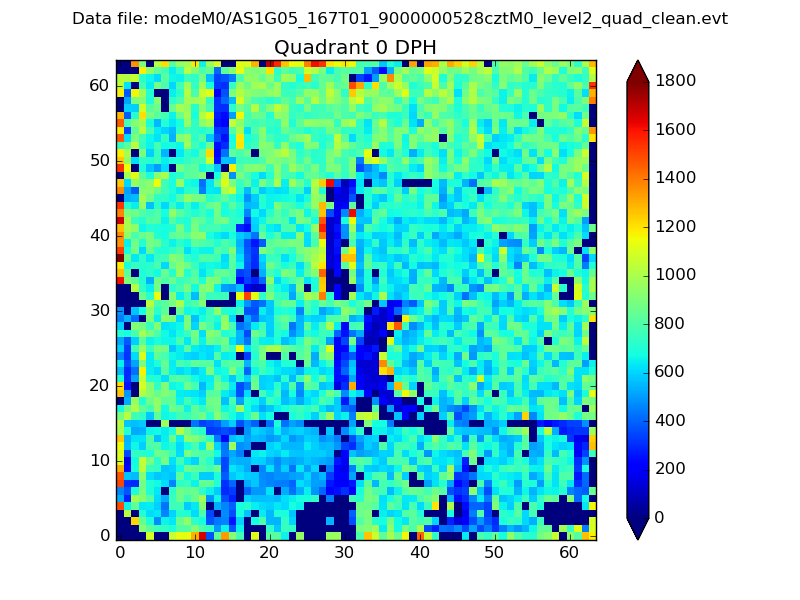 |
 |
Quadrant B |
|---|---|---|---|
| Quadrant D | 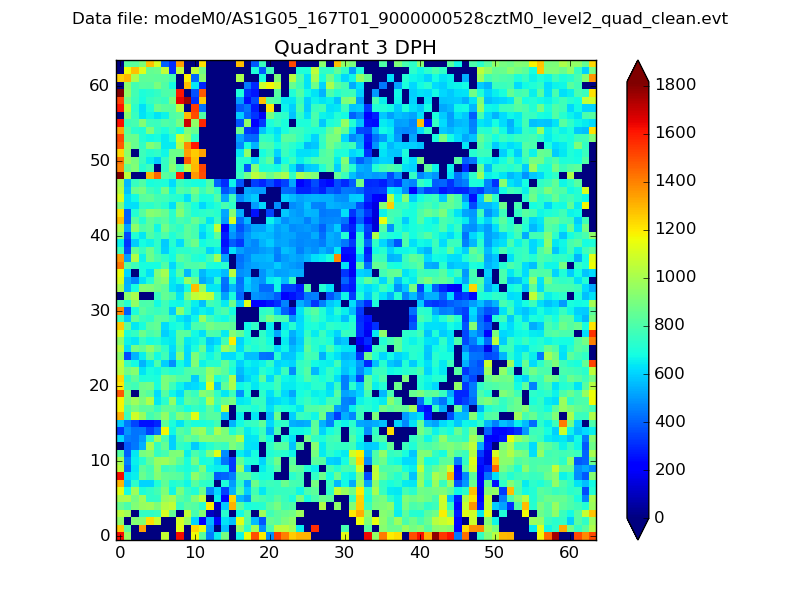 |
 |
Quadrant C |
| Plot type | Count rate plots | Images |
|---|---|---|
| Comparison with Poisson distribution Blue bars denote a histogram of data divided into 1 sec bins. Red curve is a Poisson curve with rate = median count rate of data. |
 |
 |
| Quadrant-wise count rates Data is divided into 100 sec bins |
 |
|
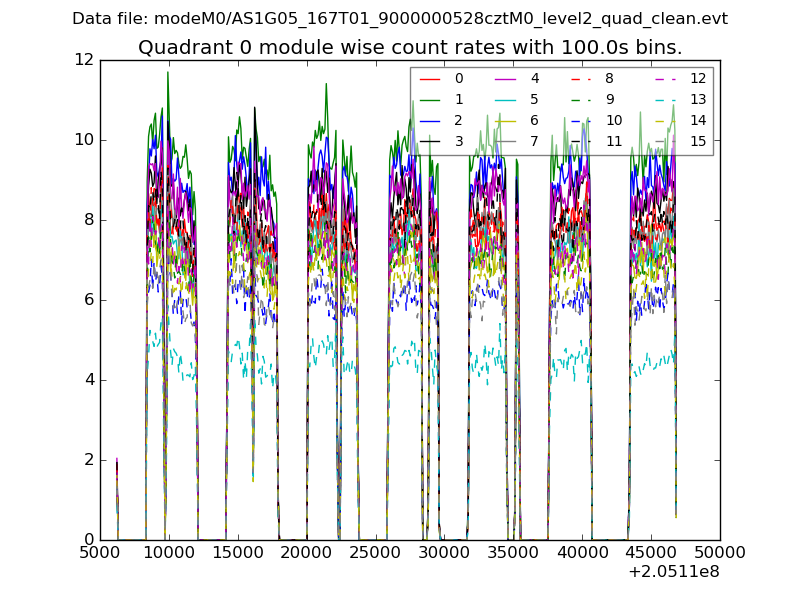
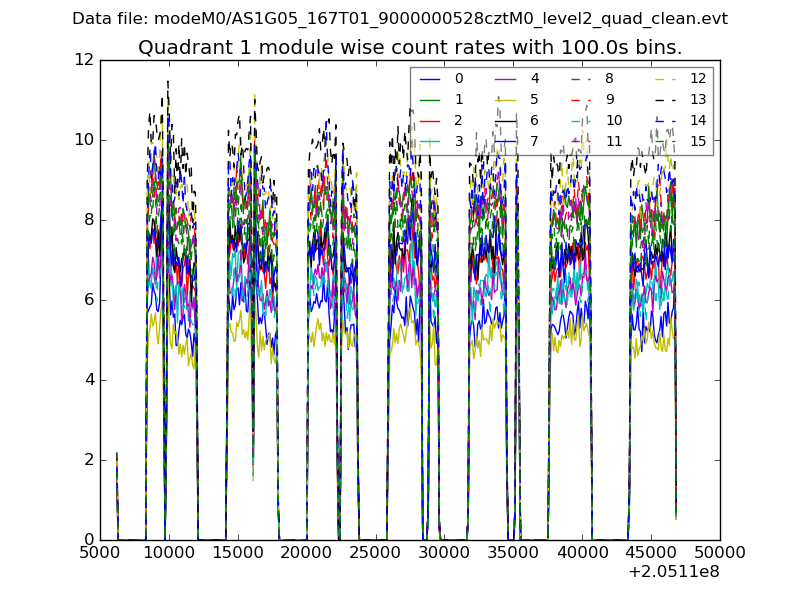
| Module-wise count rates for Quadrant A Data is divided into 100 sec bins |
 |
 |
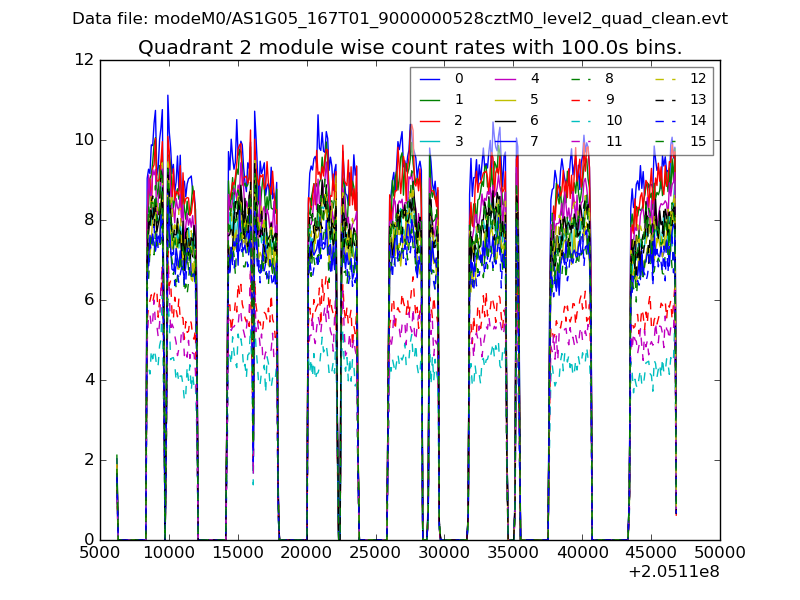
| Module-wise count rates for Quadrant B Data is divided into 100 sec bins |
 |
 |
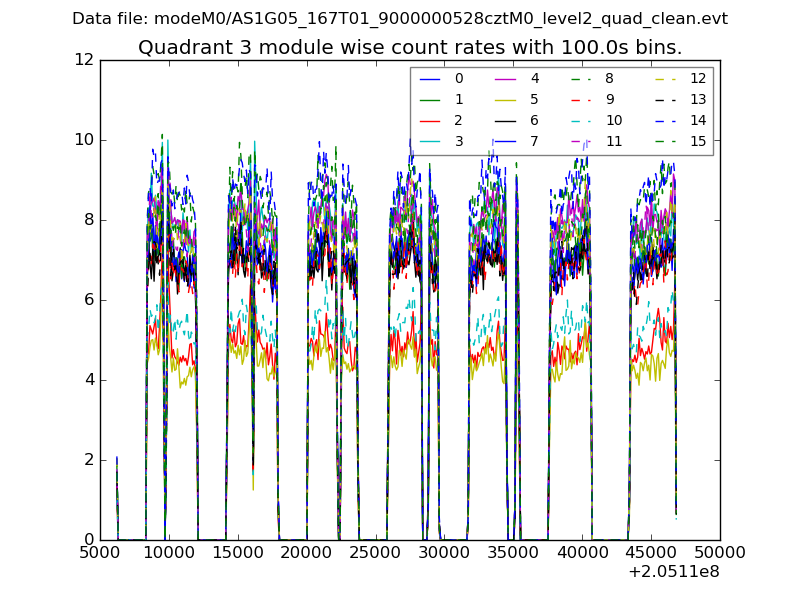
| Module-wise count rates for Quadrant C Data is divided into 100 sec bins |
 |
 |
| Module-wise count rates for Quadrant D Data is divided into 100 sec bins |
 |
 |
| Parameter | Plot |
|---|---|
| CZT HV Monitor |  |
| D_VDD |  |
| Temperature 1 | 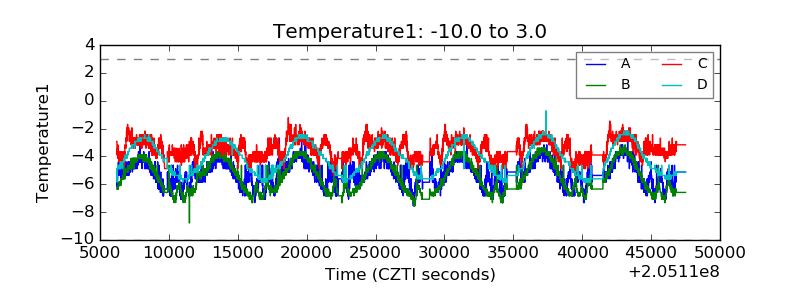 |
| Veto HV Monitor |  |
| Veto LLD |  |
| Alpha Counter | 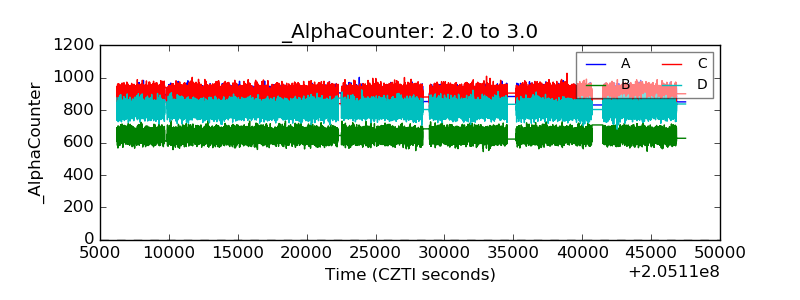 |
| _CPM_Rate |  |
| CZT Counter |  |
| +2.5 Volts monitor |  |
| +5 Volts monitor | 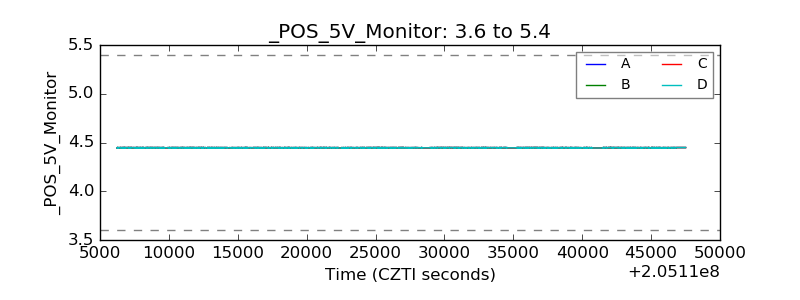 |
| _ROLL_ROT |  |
| _Roll_DEC |  |
| _Roll_RA |  |
| Veto Counter |  |