| Param | Original file | Final file |
|---|---|---|
| Filename | modeM0/AS1G05_192T01_9000000526cztM0_level2_bc.evt | modeM0/AS1G05_192T01_9000000526cztM0_level2_quad_clean.evt |
| Size (bytes) | 620,400,960 | 221,613,120 |
| Size | 591.7 MB | 211.3 MB |
| Events in quadrant A | 4,756,641 | 1,341,360 |
| Events in quadrant B | 3,964,036 | 1,401,150 |
| Events in quadrant C | 4,881,258 | 1,374,351 |
| Events in quadrant D | 3,938,671 | 1,340,741 |
| Mode SS | |||
|---|---|---|---|
| Quadrant | BADHDUFLAG | Total packets | Discarded packets |
| A | 0 | 374 | 0 |
| B | 0 | 374 | 0 |
| C | 0 | 374 | 0 |
| D | 0 | 374 | 0 |
| Mode M9 | |||
|---|---|---|---|
| Quadrant | BADHDUFLAG | Total packets | Discarded packets |
| A | 0 | 45 | 0 |
| B | 0 | 45 | 0 |
| C | 0 | 45 | 0 |
| D | 0 | 45 | 0 |
| Mode M0 | |||
|---|---|---|---|
| Quadrant | BADHDUFLAG | Total packets | Discarded packets |
| A | 0 | 44704 | 0 |
| B | 0 | 38667 | 0 |
| C | 0 | 45571 | 0 |
| D | 0 | 39027 | 0 |
| Quadrant | Total seconds | Saturated seconds | Saturation percentage |
|---|---|---|---|
| A | 18192 | 959 | 5.271548% |
| B | 18192 | 202 | 1.110378% |
| C | 18192 | 1155 | 6.348945% |
| D | 18192 | 218 | 1.198329% |
Noise dominated data is calculated using 1-second bins in cleaned event files. If a bin has >2000 counts, and if more than 50% of those come from <1% of pixels, then it is considered to be noise-dominated and hence unusable.
| Quadrant | # 1 sec bins | Bins with >0 counts | Bins with >2000 counts | High rate bins dominated by noise | Noise dominated (total time) | Noise dominated (detector-on time) | Marked lightcurve |
|---|---|---|---|---|---|---|---|
| A | 22736 | 18187 | 10 | 10 | 0.04% | 0.05% |  |
| B | 22736 | 18187 | 2 | 2 | 0.01% | 0.01% | 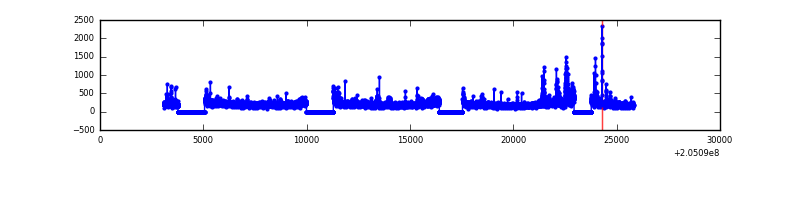 |
| C | 22736 | 18190 | 7 | 7 | 0.03% | 0.04% |  |
| D | 22736 | 18189 | 3 | 3 | 0.01% | 0.02% |  |
Top three noisy pixels from each quadrant. If the there are fewer than three noisy pixels in the level2.evt file, extra rows are filled as -1
| Pixel properties | Quadrant properties | ||||||
|---|---|---|---|---|---|---|---|
| Quadrant | DetID | PixID | Counts | Sigma | Mean | Median | Sigma |
| A | 14 | 111 | 694906 | 3602.39 | 873 | 853 | 192.7 |
| A | 0 | 199 | 554308 | 2872.63 | 873 | 853 | 192.7 |
| A | 0 | 50 | 73048 | 374.72 | 873 | 853 | 192.7 |
| B | 14 | 167 | 179114 | 1003.39 | 916 | 891 | 177.6 |
| B | 15 | 204 | 147211 | 823.78 | 916 | 891 | 177.6 |
| B | 0 | 183 | 35951 | 197.39 | 916 | 891 | 177.6 |
| C | 9 | 144 | 1362635 | 7014.08 | 867 | 852 | 194.2 |
| C | 4 | 254 | 55436 | 281.14 | 867 | 852 | 194.2 |
| C | 5 | 190 | 38838 | 195.65 | 867 | 852 | 194.2 |
| D | 10 | 172 | 176194 | 844.53 | 891 | 857 | 207.6 |
| D | 13 | 239 | 118233 | 565.35 | 891 | 857 | 207.6 |
| D | 2 | 232 | 76024 | 362.05 | 891 | 857 | 207.6 |
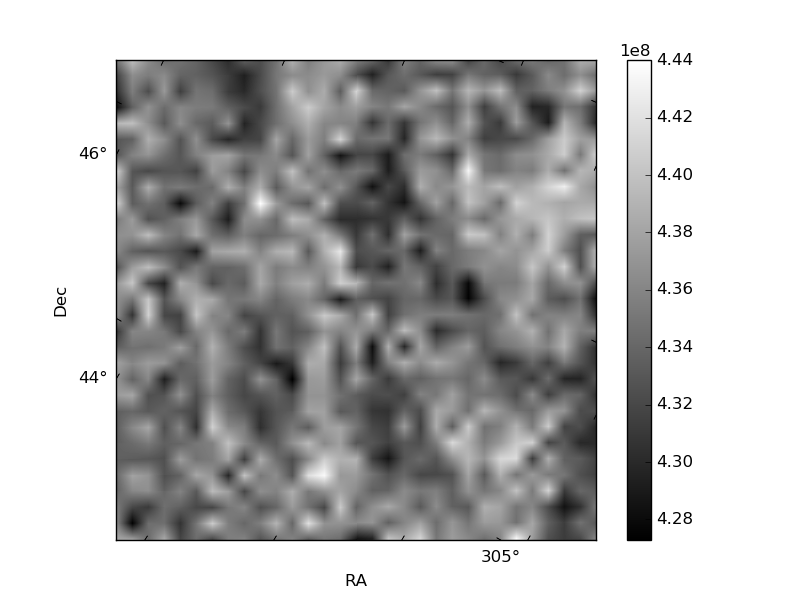
Histogram calculated using DETX and DETY for each event in the final _common_clean file
| Quadrant A | 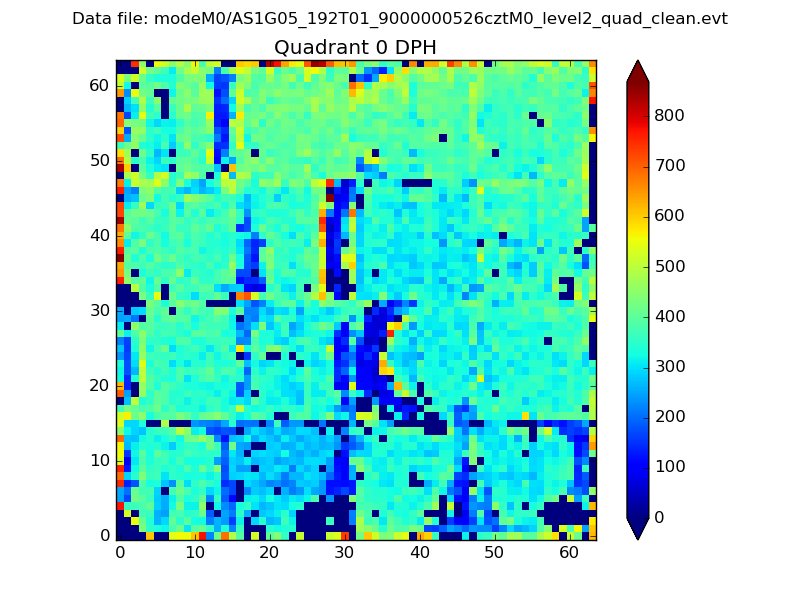 |
 |
Quadrant B |
|---|---|---|---|
| Quadrant D |  |
 |
Quadrant C |
| Plot type | Count rate plots | Images |
|---|---|---|
| Comparison with Poisson distribution Blue bars denote a histogram of data divided into 1 sec bins. Red curve is a Poisson curve with rate = median count rate of data. |
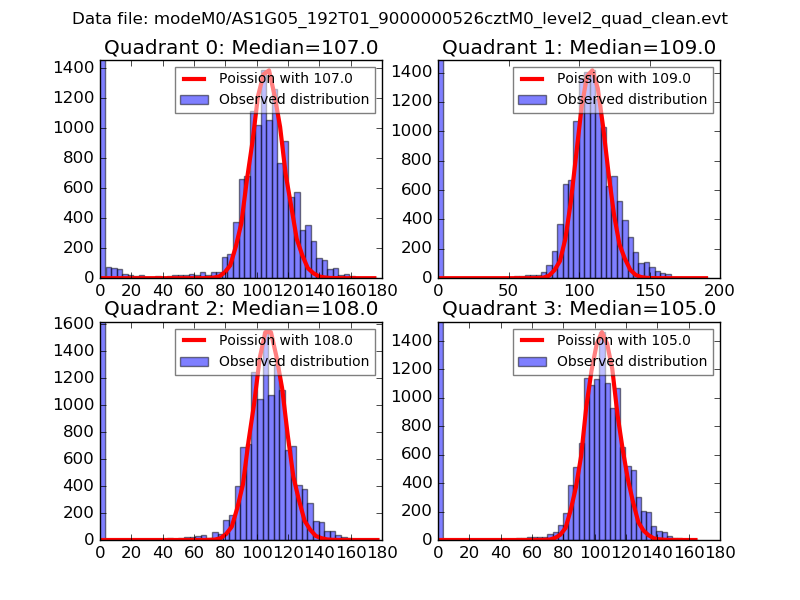 |
 |
| Quadrant-wise count rates Data is divided into 100 sec bins |
 |
|
| Module-wise count rates for Quadrant A Data is divided into 100 sec bins |
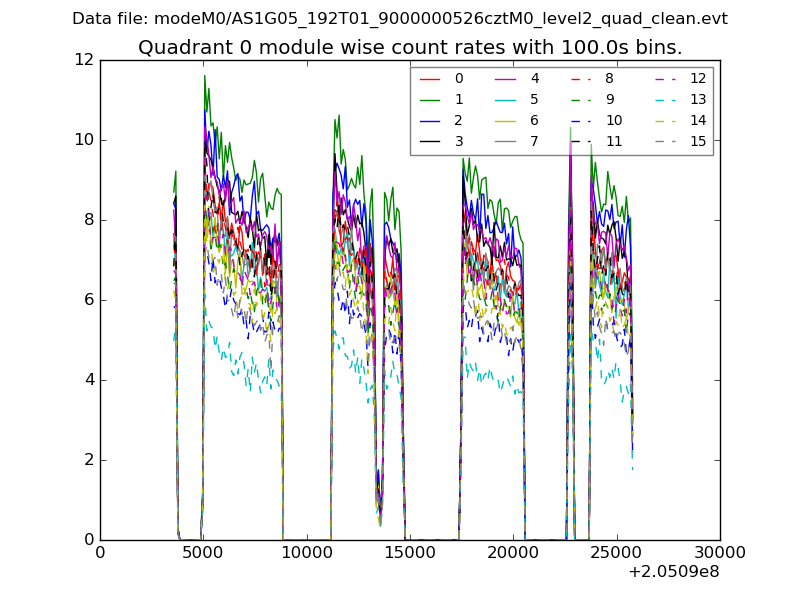 |
 |
| Module-wise count rates for Quadrant B Data is divided into 100 sec bins |
 |
 |
| Module-wise count rates for Quadrant C Data is divided into 100 sec bins |
 |
 |
| Module-wise count rates for Quadrant D Data is divided into 100 sec bins |
 |
 |
| Parameter | Plot |
|---|---|
| CZT HV Monitor |  |
| D_VDD |  |
| Temperature 1 |  |
| Veto HV Monitor |  |
| Veto LLD |  |
| Alpha Counter |  |
| _CPM_Rate | 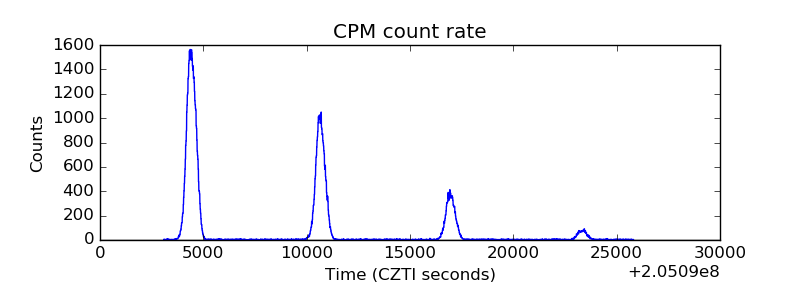 |
| CZT Counter | 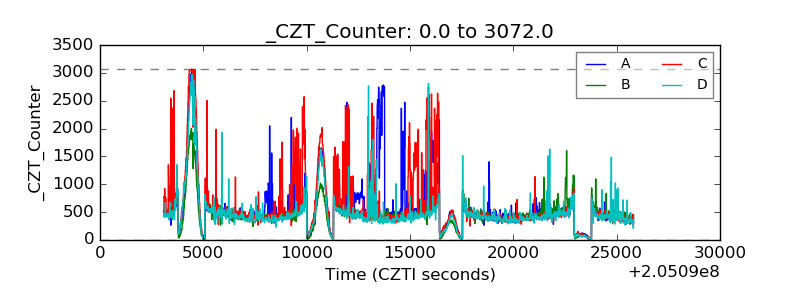 |
| +2.5 Volts monitor |  |
| +5 Volts monitor |  |
| _ROLL_ROT | 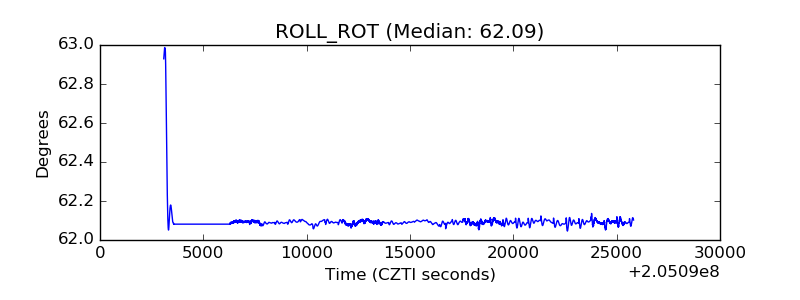 |
| _Roll_DEC |  |
| _Roll_RA |  |
| Veto Counter | 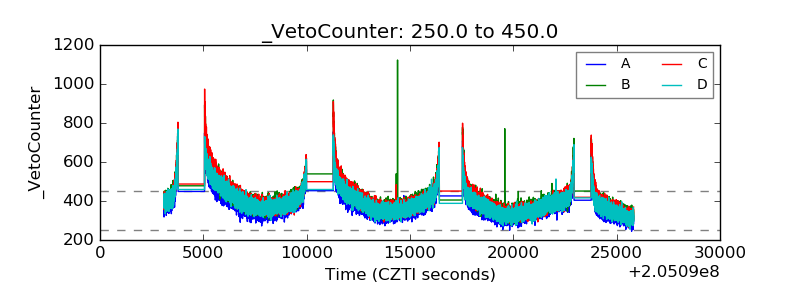 |