| Param | Original file | Final file |
|---|---|---|
| Filename | modeM0/AS1G05_191T01_9000000524cztM0_level2_bc.evt | modeM0/AS1G05_191T01_9000000524cztM0_level2_quad_clean.evt |
| Size (bytes) | 1,974,631,680 | 740,494,080 |
| Size | 1.8 GB | 706.2 MB |
| Events in quadrant A | 14,074,544 | 4,679,353 |
| Events in quadrant B | 14,705,111 | 4,670,280 |
| Events in quadrant C | 13,822,708 | 4,603,417 |
| Events in quadrant D | 13,204,985 | 4,458,272 |
| Mode M0 | |||
|---|---|---|---|
| Quadrant | BADHDUFLAG | Total packets | Discarded packets |
| A | 0 | 127640 | 0 |
| B | 0 | 128688 | 0 |
| C | 0 | 131560 | 0 |
| D | 0 | 125694 | 0 |
| Mode M9 | |||
|---|---|---|---|
| Quadrant | BADHDUFLAG | Total packets | Discarded packets |
| A | 0 | 70 | 0 |
| B | 0 | 70 | 0 |
| C | 0 | 70 | 0 |
| D | 0 | 70 | 0 |
| Mode SS | |||
|---|---|---|---|
| Quadrant | BADHDUFLAG | Total packets | Discarded packets |
| A | 0 | 1186 | 0 |
| B | 0 | 1186 | 0 |
| C | 0 | 1186 | 0 |
| D | 0 | 1186 | 0 |
| Quadrant | Total seconds | Saturated seconds | Saturation percentage |
|---|---|---|---|
| A | 58579 | 1211 | 2.067294% |
| B | 58580 | 1448 | 2.471833% |
| C | 58580 | 1357 | 2.316490% |
| D | 58580 | 1018 | 1.737794% |
Noise dominated data is calculated using 1-second bins in cleaned event files. If a bin has >2000 counts, and if more than 50% of those come from <1% of pixels, then it is considered to be noise-dominated and hence unusable.
| Quadrant | # 1 sec bins | Bins with >0 counts | Bins with >2000 counts | High rate bins dominated by noise | Noise dominated (total time) | Noise dominated (detector-on time) | Marked lightcurve |
|---|---|---|---|---|---|---|---|
| A | 65380 | 58574 | 2 | 2 | 0.00% | 0.00% |  |
| B | 65380 | 58573 | 139 | 139 | 0.21% | 0.24% |  |
| C | 65380 | 58574 | 14 | 14 | 0.02% | 0.02% |  |
| D | 65380 | 58575 | 24 | 24 | 0.04% | 0.04% |  |
Top three noisy pixels from each quadrant. If the there are fewer than three noisy pixels in the level2.evt file, extra rows are filled as -1
| Pixel properties | Quadrant properties | ||||||
|---|---|---|---|---|---|---|---|
| Quadrant | DetID | PixID | Counts | Sigma | Mean | Median | Sigma |
| A | 0 | 199 | 1775021 | 2583.72 | 3004 | 2937 | 685.9 |
| A | 0 | 50 | 393013 | 568.74 | 3004 | 2937 | 685.9 |
| A | 0 | 226 | 156094 | 223.3 | 3004 | 2937 | 685.9 |
| B | 14 | 167 | 1622705 | 2754.29 | 3027 | 2963 | 588.1 |
| B | 3 | 0 | 450379 | 760.81 | 3027 | 2963 | 588.1 |
| B | 10 | 16 | 445695 | 752.84 | 3027 | 2963 | 588.1 |
| C | 9 | 144 | 2160256 | 3253.07 | 2945 | 2919 | 663.2 |
| C | 8 | 128 | 60653 | 87.06 | 2945 | 2919 | 663.2 |
| C | 8 | 112 | 23895 | 31.63 | 2945 | 2919 | 663.2 |
| D | 10 | 172 | 817471 | 1160.65 | 2955 | 2843 | 701.9 |
| D | 13 | 239 | 339335 | 479.42 | 2955 | 2843 | 701.9 |
| D | 2 | 14 | 239977 | 337.86 | 2955 | 2843 | 701.9 |
Histogram calculated using DETX and DETY for each event in the final _common_clean file
| Quadrant A |  |
 |
Quadrant B |
|---|---|---|---|
| Quadrant D |  |
 |
Quadrant C |
| Plot type | Count rate plots | Images |
|---|---|---|
| Comparison with Poisson distribution Blue bars denote a histogram of data divided into 1 sec bins. Red curve is a Poisson curve with rate = median count rate of data. |
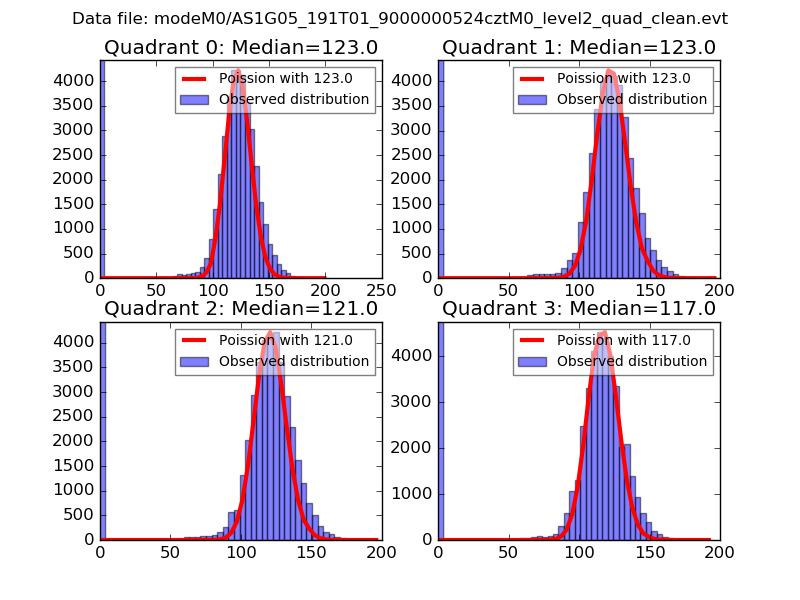 |
 |
| Quadrant-wise count rates Data is divided into 100 sec bins |
 |
|
| Module-wise count rates for Quadrant A Data is divided into 100 sec bins |
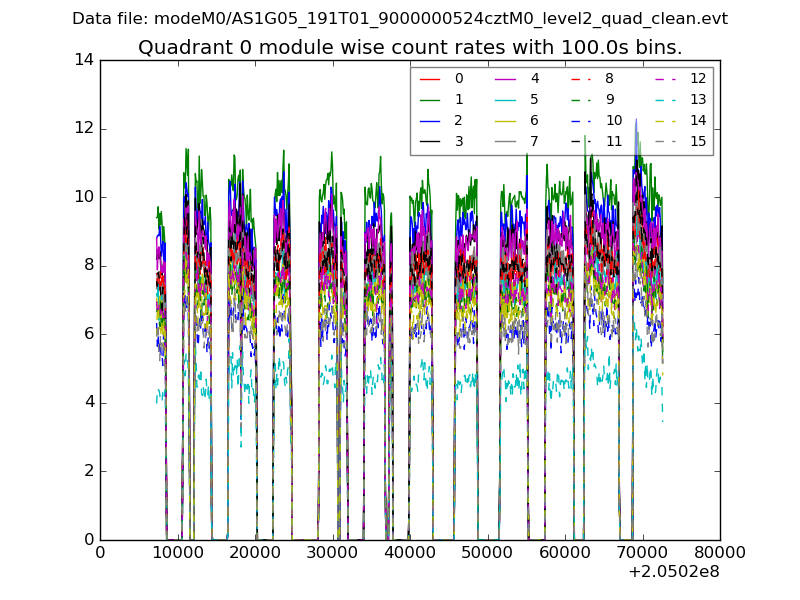 |
 |
| Module-wise count rates for Quadrant B Data is divided into 100 sec bins |
 |
 |
| Module-wise count rates for Quadrant C Data is divided into 100 sec bins |
 |
 |
| Module-wise count rates for Quadrant D Data is divided into 100 sec bins |
 |
 |
| Parameter | Plot |
|---|---|
| CZT HV Monitor | 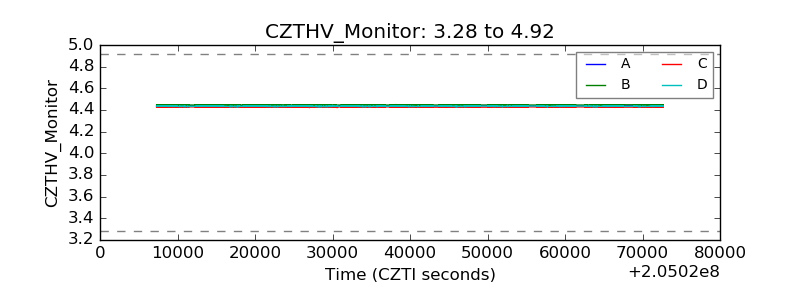 |
| D_VDD |  |
| Temperature 1 |  |
| Veto HV Monitor |  |
| Veto LLD |  |
| Alpha Counter | 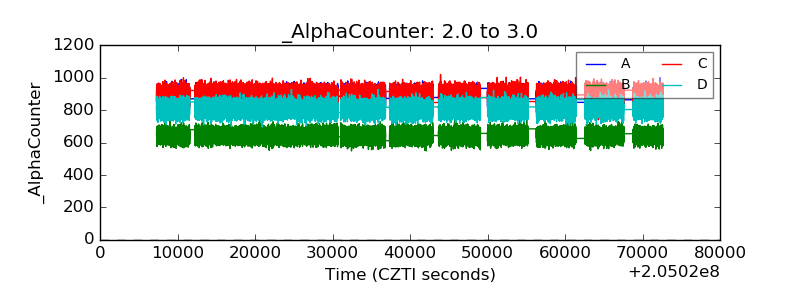 |
| _CPM_Rate |  |
| CZT Counter |  |
| +2.5 Volts monitor |  |
| +5 Volts monitor |  |
| _ROLL_ROT | 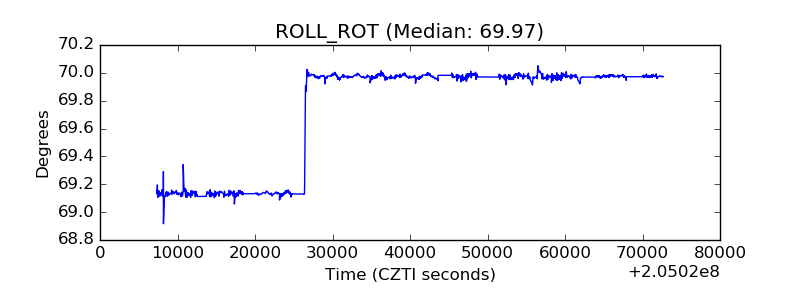 |
| _Roll_DEC |  |
| _Roll_RA |  |
| Veto Counter |  |