| Param | Original file | Final file |
|---|---|---|
| Filename | modeM0/AS1G05_192T01_9000000522cztM0_level2_bc.evt | modeM0/AS1G05_192T01_9000000522cztM0_level2_quad_clean.evt |
| Size (bytes) | 1,444,256,640 | 284,420,160 |
| Size | 1.3 GB | 271.2 MB |
| Events in quadrant A | 5,252,210 | 1,879,363 |
| Events in quadrant B | 10,467,151 | 1,851,331 |
| Events in quadrant C | 21,111,443 | 1,496,986 |
| Events in quadrant D | 5,354,855 | 1,816,292 |
| Mode M9 | |||
|---|---|---|---|
| Quadrant | BADHDUFLAG | Total packets | Discarded packets |
| A | 0 | 61 | 0 |
| B | 0 | 61 | 0 |
| C | 0 | 61 | 0 |
| D | 0 | 61 | 0 |
| Mode SS | |||
|---|---|---|---|
| Quadrant | BADHDUFLAG | Total packets | Discarded packets |
| A | 0 | 464 | 0 |
| B | 0 | 464 | 0 |
| C | 0 | 464 | 0 |
| D | 0 | 464 | 0 |
| Mode M0 | |||
|---|---|---|---|
| Quadrant | BADHDUFLAG | Total packets | Discarded packets |
| A | 0 | 49569 | 0 |
| B | 0 | 65546 | 0 |
| C | 0 | 97922 | 0 |
| D | 0 | 49512 | 0 |
| Quadrant | Total seconds | Saturated seconds | Saturation percentage |
|---|---|---|---|
| A | 22773 | 271 | 1.190006% |
| B | 22773 | 1163 | 5.106925% |
| C | 22773 | 8377 | 36.784789% |
| D | 22773 | 270 | 1.185615% |
Noise dominated data is calculated using 1-second bins in cleaned event files. If a bin has >2000 counts, and if more than 50% of those come from <1% of pixels, then it is considered to be noise-dominated and hence unusable.
| Quadrant | # 1 sec bins | Bins with >0 counts | Bins with >2000 counts | High rate bins dominated by noise | Noise dominated (total time) | Noise dominated (detector-on time) | Marked lightcurve |
|---|---|---|---|---|---|---|---|
| A | 28848 | 22772 | 1 | 1 | 0.00% | 0.00% |  |
| B | 28848 | 22769 | 127 | 127 | 0.44% | 0.56% | 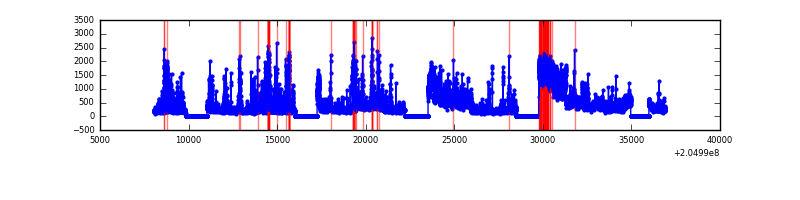 |
| C | 28848 | 22770 | 6773 | 6773 | 23.48% | 29.75% |  |
| D | 28848 | 22771 | 35 | 35 | 0.12% | 0.15% |  |
Top three noisy pixels from each quadrant. If the there are fewer than three noisy pixels in the level2.evt file, extra rows are filled as -1
| Pixel properties | Quadrant properties | ||||||
|---|---|---|---|---|---|---|---|
| Quadrant | DetID | PixID | Counts | Sigma | Mean | Median | Sigma |
| A | 0 | 199 | 566799 | 2205.35 | 1161 | 1139 | 256.5 |
| A | 0 | 50 | 86061 | 331.09 | 1161 | 1139 | 256.5 |
| A | 0 | 226 | 55470 | 211.82 | 1161 | 1139 | 256.5 |
| B | 3 | 0 | 4412932 | 19830.0 | 1165 | 1134 | 222.5 |
| B | 10 | 16 | 959684 | 4308.46 | 1165 | 1134 | 222.5 |
| B | 14 | 167 | 329575 | 1476.27 | 1165 | 1134 | 222.5 |
| C | 12 | 204 | 17217608 | 78939.13 | 974 | 962 | 218.1 |
| C | 10 | 65 | 23053 | 101.29 | 974 | 962 | 218.1 |
| C | 14 | 234 | 22540 | 98.94 | 974 | 962 | 218.1 |
| D | 10 | 172 | 340407 | 1283.64 | 1151 | 1113 | 264.3 |
| D | 13 | 239 | 136248 | 511.25 | 1151 | 1113 | 264.3 |
| D | 2 | 37 | 96185 | 359.68 | 1151 | 1113 | 264.3 |
Histogram calculated using DETX and DETY for each event in the final _common_clean file
| Quadrant A |  |
 |
Quadrant B |
|---|---|---|---|
| Quadrant D |  |
 |
Quadrant C |
| Plot type | Count rate plots | Images |
|---|---|---|
| Comparison with Poisson distribution Blue bars denote a histogram of data divided into 1 sec bins. Red curve is a Poisson curve with rate = median count rate of data. |
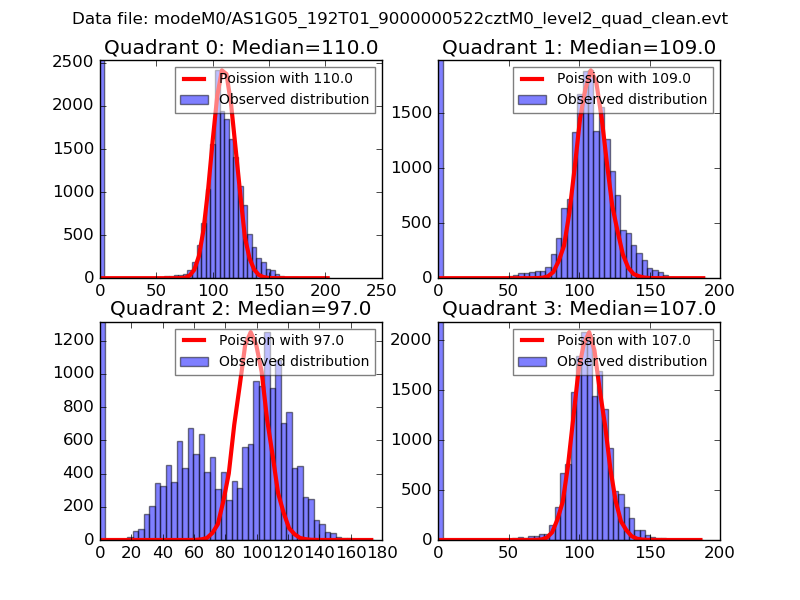 |
 |
| Quadrant-wise count rates Data is divided into 100 sec bins |
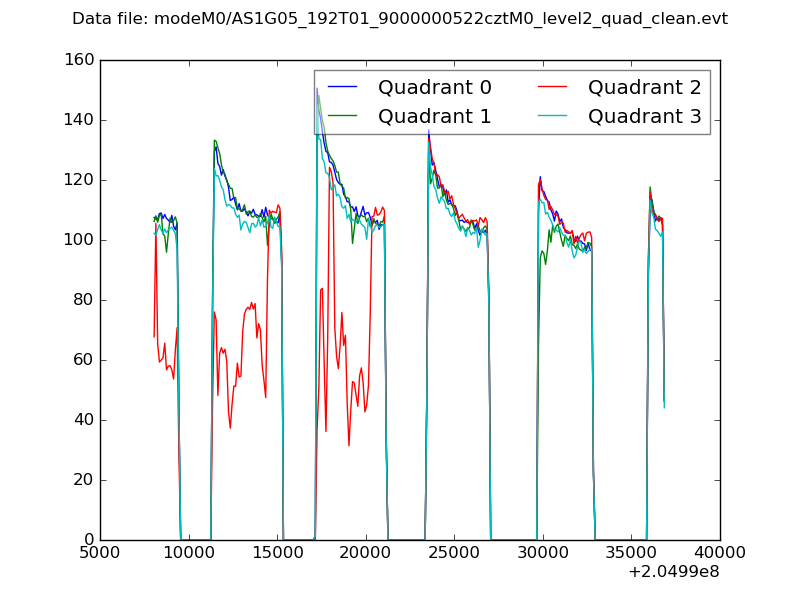 |
|
| Module-wise count rates for Quadrant A Data is divided into 100 sec bins |
 |
 |
| Module-wise count rates for Quadrant B Data is divided into 100 sec bins |
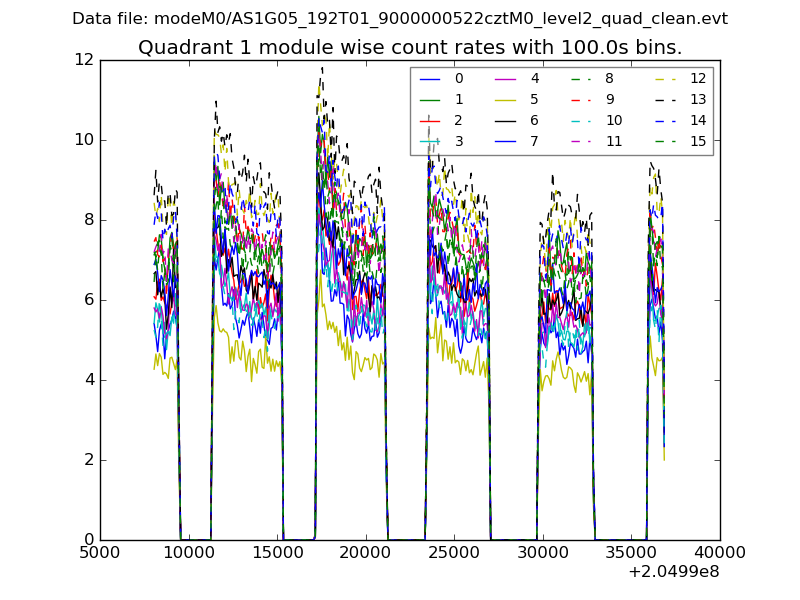 |
 |
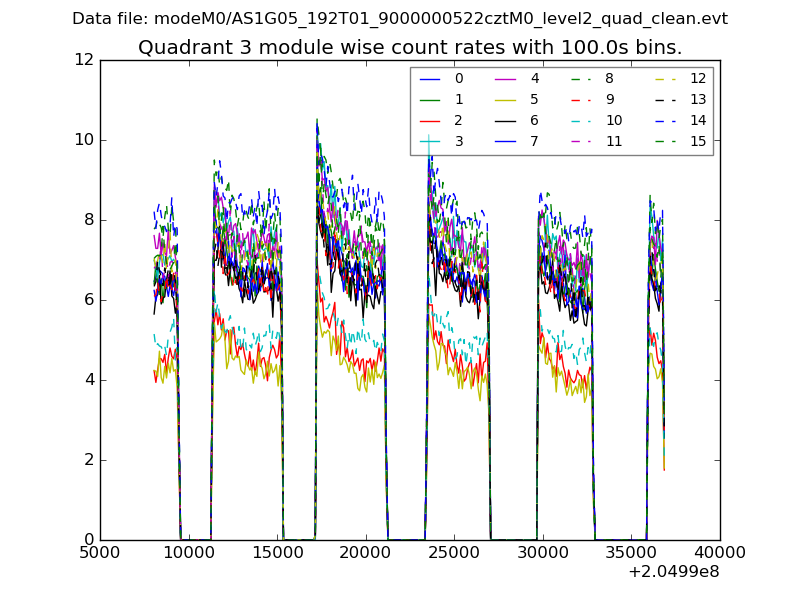
| Module-wise count rates for Quadrant C Data is divided into 100 sec bins |
 |
 |
| Module-wise count rates for Quadrant D Data is divided into 100 sec bins |
 |
 |
| Parameter | Plot |
|---|---|
| CZT HV Monitor |  |
| D_VDD |  |
| Temperature 1 |  |
| Veto HV Monitor |  |
| Veto LLD |  |
| Alpha Counter |  |
| _CPM_Rate | 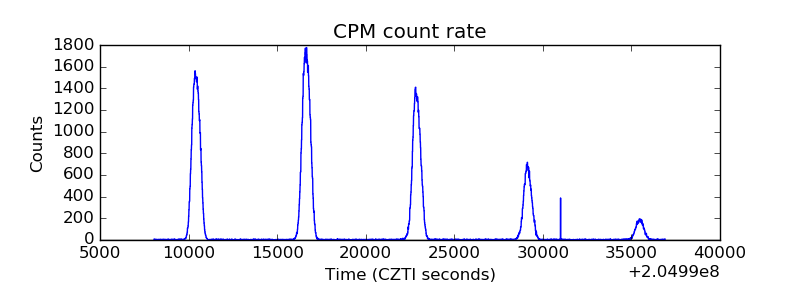 |
| CZT Counter |  |
| +2.5 Volts monitor |  |
| +5 Volts monitor |  |
| _ROLL_ROT |  |
| _Roll_DEC |  |
| _Roll_RA |  |
| Veto Counter |  |