| Param | Original file | Final file |
|---|---|---|
| Filename | modeM0/AS1G05_222T01_9000000520cztM0_level2.evt | modeM0/AS1G05_222T01_9000000520cztM0_level2_quad_clean.evt |
| Size (bytes) | 9,692,928,000 | 1,550,269,440 |
| Size | 9.0 GB | 1.4 GB |
| Events in quadrant A | 65,165,247 | 9,639,066 |
| Events in quadrant B | 70,983,675 | 9,723,341 |
| Events in quadrant C | 79,994,839 | 9,375,256 |
| Events in quadrant D | 68,545,874 | 9,212,507 |
| Mode M0 | |||
|---|---|---|---|
| Quadrant | BADHDUFLAG | Total packets | Discarded packets |
| A | 0 | 283883 | 0 |
| B | 0 | 297527 | 0 |
| C | 0 | 329676 | 0 |
| D | 0 | 299737 | 0 |
| Mode SS | |||
|---|---|---|---|
| Quadrant | BADHDUFLAG | Total packets | Discarded packets |
| A | 0 | 2674 | 0 |
| B | 0 | 2678 | 0 |
| C | 0 | 2678 | 0 |
| D | 0 | 2681 | 0 |
| Mode M9 | |||
|---|---|---|---|
| Quadrant | BADHDUFLAG | Total packets | Discarded packets |
| A | 0 | 180 | 0 |
| B | 0 | 180 | 0 |
| C | 0 | 180 | 0 |
| D | 0 | 180 | 0 |
| Quadrant | Total seconds | Saturated seconds | Saturation percentage |
|---|---|---|---|
| A | 131418 | 2789 | 2.122236% |
| B | 131304 | 3819 | 2.908518% |
| C | 131401 | 9160 | 6.971028% |
| D | 131279 | 3624 | 2.760533% |
Noise dominated data is calculated using 1-second bins in cleaned event files. If a bin has >2000 counts, and if more than 50% of those come from <1% of pixels, then it is considered to be noise-dominated and hence unusable.
| Quadrant | # 1 sec bins | Bins with >0 counts | Bins with >2000 counts | High rate bins dominated by noise | Noise dominated (total time) | Noise dominated (detector-on time) | Marked lightcurve |
|---|---|---|---|---|---|---|---|
| A | 150466 | 132093 | 550 | 550 | 0.37% | 0.42% | 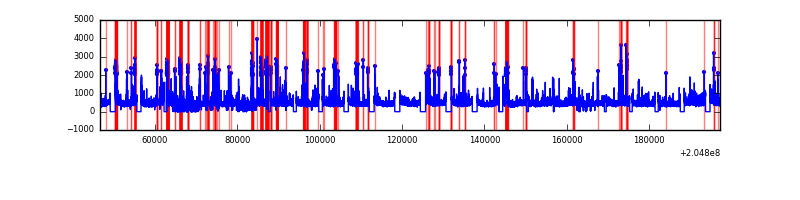 |
| B | 150466 | 132018 | 1364 | 1364 | 0.91% | 1.03% | 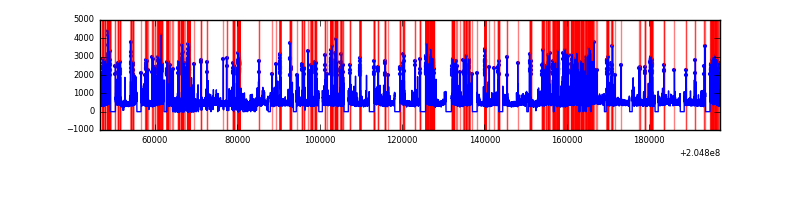 |
| C | 150465 | 132090 | 7729 | 7729 | 5.14% | 5.85% |  |
| D | 150466 | 132020 | 1834 | 1834 | 1.22% | 1.39% | 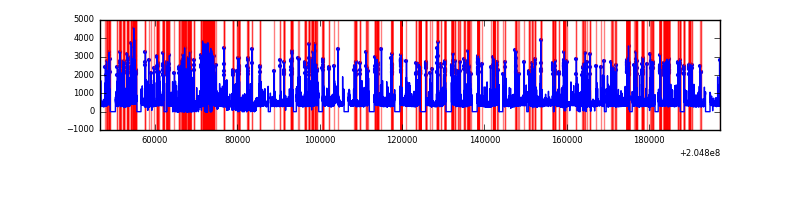 |
Top three noisy pixels from each quadrant. If the there are fewer than three noisy pixels in the level2.evt file, extra rows are filled as -1
| Pixel properties | Quadrant properties | ||||||
|---|---|---|---|---|---|---|---|
| Quadrant | DetID | PixID | Counts | Sigma | Mean | Median | Sigma |
| A | 0 | 50 | 2768688 | 879.28 | 15386 | 15043 | 3131.7 |
| A | 0 | 199 | 1631250 | 516.08 | 15386 | 15043 | 3131.7 |
| A | 8 | 15 | 487515 | 150.87 | 15386 | 15043 | 3131.7 |
| B | 10 | 16 | 3839975 | 1284.84 | 15528 | 15170 | 2976.9 |
| B | 14 | 167 | 3343518 | 1118.07 | 15528 | 15170 | 2976.9 |
| B | 3 | 0 | 1047359 | 346.74 | 15528 | 15170 | 2976.9 |
| C | 12 | 204 | 19167494 | 5576.65 | 14790 | 14846 | 3434.4 |
| C | 9 | 144 | 2954313 | 855.88 | 14790 | 14846 | 3434.4 |
| C | 13 | 61 | 122124 | 31.24 | 14790 | 14846 | 3434.4 |
| D | 2 | 232 | 4744177 | 1290.23 | 14961 | 14509 | 3665.7 |
| D | 10 | 172 | 2255682 | 611.38 | 14961 | 14509 | 3665.7 |
| D | 12 | 233 | 1409224 | 380.47 | 14961 | 14509 | 3665.7 |
Histogram calculated using DETX and DETY for each event in the final _common_clean file
| Quadrant A | 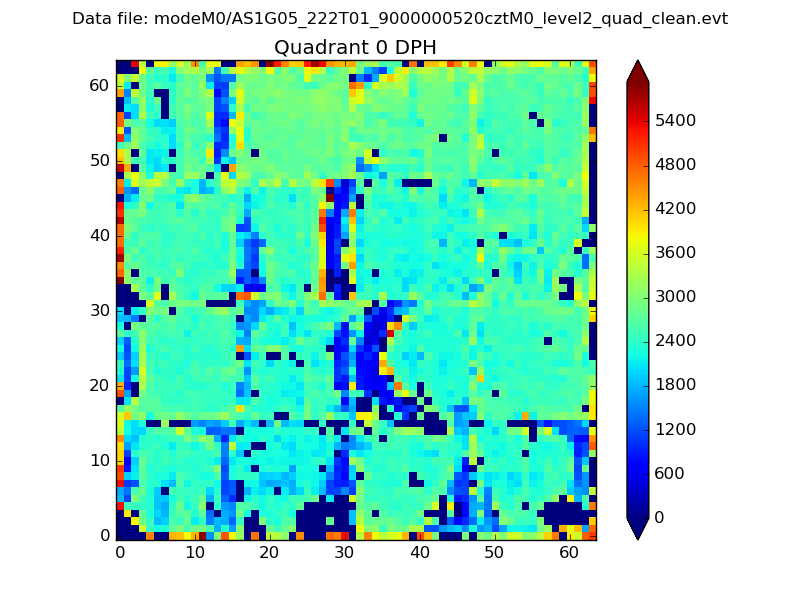 |
 |
Quadrant B |
|---|---|---|---|
| Quadrant D | 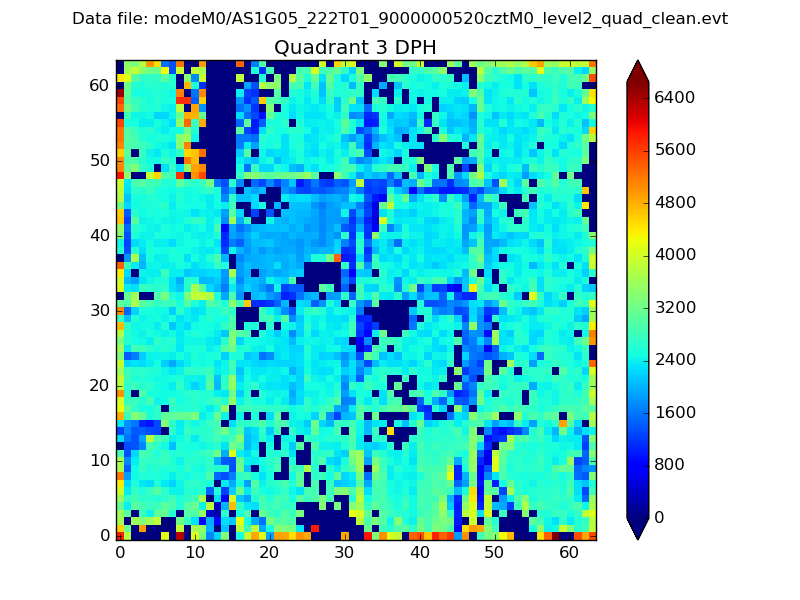 |
 |
Quadrant C |
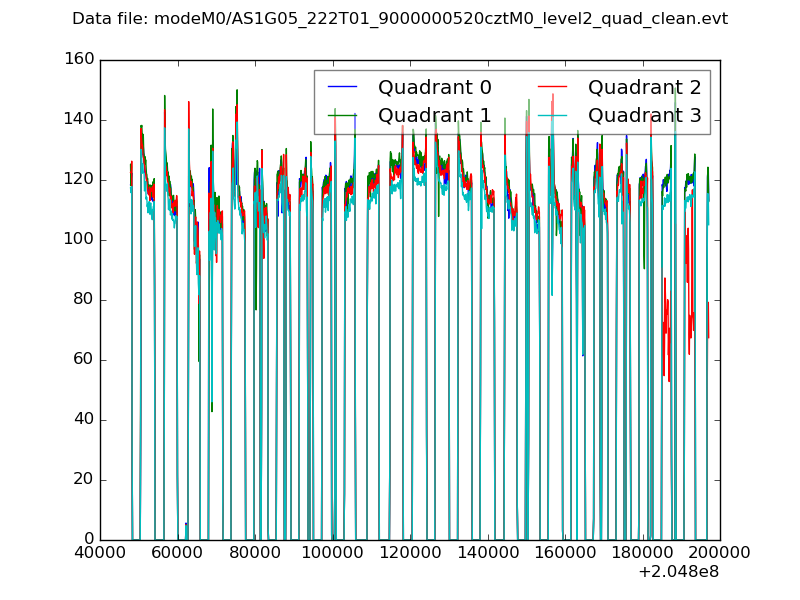
| Plot type | Count rate plots | Images |
|---|---|---|
| Comparison with Poisson distribution Blue bars denote a histogram of data divided into 1 sec bins. Red curve is a Poisson curve with rate = median count rate of data. |
 |
 |
| Quadrant-wise count rates Data is divided into 100 sec bins |
 |
|
| Module-wise count rates for Quadrant A Data is divided into 100 sec bins |
 |
 |
| Module-wise count rates for Quadrant B Data is divided into 100 sec bins |
 |
 |
| Module-wise count rates for Quadrant C Data is divided into 100 sec bins |
 |
 |
| Module-wise count rates for Quadrant D Data is divided into 100 sec bins |
 |
 |
| Parameter | Plot |
|---|---|
| CZT HV Monitor | 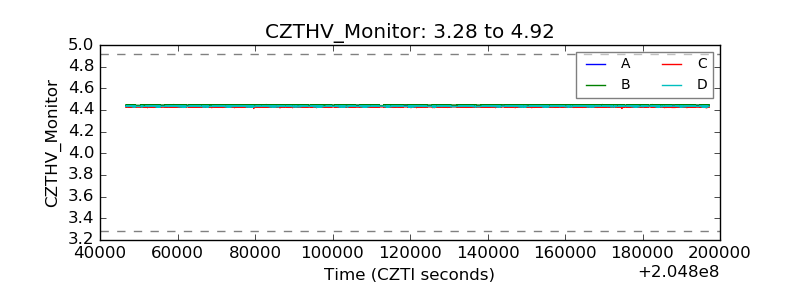 |
| D_VDD |  |
| Temperature 1 | 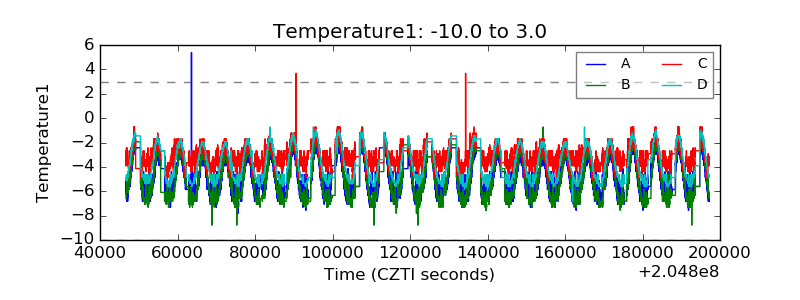 |
| Veto HV Monitor |  |
| Veto LLD |  |
| Alpha Counter |  |
| _CPM_Rate |  |
| CZT Counter |  |
| +2.5 Volts monitor |  |
| +5 Volts monitor |  |
| _ROLL_ROT |  |
| _Roll_DEC |  |
| _Roll_RA |  |
| Veto Counter | 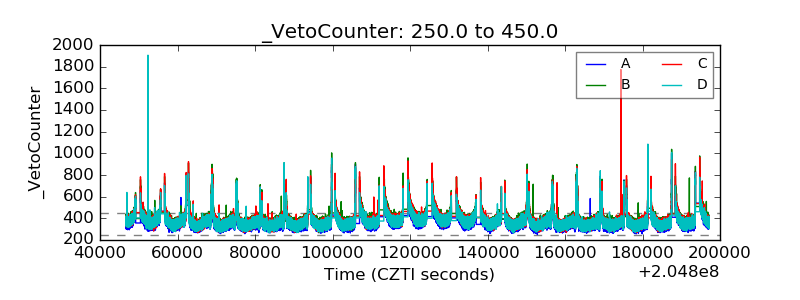 |