| Param | Original file | Final file |
|---|---|---|
| Filename | modeM0/AS1G05_241T04_9000000518cztM0_level2_bc.evt | modeM0/AS1G05_241T04_9000000518cztM0_level2_quad_clean.evt |
| Size (bytes) | 3,756,971,520 | 1,182,314,880 |
| Size | 3.5 GB | 1.1 GB |
| Events in quadrant A | 28,518,064 | 7,024,960 |
| Events in quadrant B | 26,793,217 | 7,116,234 |
| Events in quadrant C | 22,291,905 | 7,017,367 |
| Events in quadrant D | 28,308,807 | 6,738,987 |
| Mode M9 | |||
|---|---|---|---|
| Quadrant | BADHDUFLAG | Total packets | Discarded packets |
| A | 0 | 194 | 0 |
| B | 0 | 194 | 0 |
| C | 0 | 194 | 0 |
| D | 0 | 194 | 0 |
| Mode M0 | |||
|---|---|---|---|
| Quadrant | BADHDUFLAG | Total packets | Discarded packets |
| A | 0 | 259446 | 0 |
| B | 0 | 249521 | 0 |
| C | 0 | 237280 | 0 |
| D | 0 | 260652 | 0 |
| Mode SS | |||
|---|---|---|---|
| Quadrant | BADHDUFLAG | Total packets | Discarded packets |
| A | 0 | 2342 | 0 |
| B | 0 | 2340 | 0 |
| C | 0 | 2342 | 0 |
| D | 0 | 2342 | 0 |
| Quadrant | Total seconds | Saturated seconds | Saturation percentage |
|---|---|---|---|
| A | 115462 | 3360 | 2.910048% |
| B | 115469 | 1954 | 1.692229% |
| C | 115460 | 981 | 0.849645% |
| D | 115478 | 2506 | 2.170110% |
Noise dominated data is calculated using 1-second bins in cleaned event files. If a bin has >2000 counts, and if more than 50% of those come from <1% of pixels, then it is considered to be noise-dominated and hence unusable.
| Quadrant | # 1 sec bins | Bins with >0 counts | Bins with >2000 counts | High rate bins dominated by noise | Noise dominated (total time) | Noise dominated (detector-on time) | Marked lightcurve |
|---|---|---|---|---|---|---|---|
| A | 134515 | 115511 | 118 | 118 | 0.09% | 0.10% |  |
| B | 134515 | 115512 | 145 | 145 | 0.11% | 0.13% |  |
| C | 134515 | 115517 | 27 | 27 | 0.02% | 0.02% |  |
| D | 134515 | 115514 | 206 | 206 | 0.15% | 0.18% |  |
Top three noisy pixels from each quadrant. If the there are fewer than three noisy pixels in the level2.evt file, extra rows are filled as -1
| Pixel properties | Quadrant properties | ||||||
|---|---|---|---|---|---|---|---|
| Quadrant | DetID | PixID | Counts | Sigma | Mean | Median | Sigma |
| A | 8 | 15 | 2833312 | 2300.13 | 5536 | 5408 | 1229.5 |
| A | 0 | 50 | 1995855 | 1618.97 | 5536 | 5408 | 1229.5 |
| A | 0 | 118 | 702109 | 566.68 | 5536 | 5408 | 1229.5 |
| B | 14 | 167 | 2206416 | 2036.94 | 5656 | 5491 | 1080.5 |
| B | 15 | 204 | 1129908 | 1040.64 | 5656 | 5491 | 1080.5 |
| B | 4 | 81 | 618092 | 566.96 | 5656 | 5491 | 1080.5 |
| C | 9 | 144 | 291883 | 235.36 | 5498 | 5401 | 1217.2 |
| C | 12 | 4 | 108371 | 84.59 | 5498 | 5401 | 1217.2 |
| C | 1 | 16 | 105893 | 82.56 | 5498 | 5401 | 1217.2 |
| D | 10 | 172 | 1966697 | 1523.83 | 5494 | 5280 | 1287.2 |
| D | 13 | 239 | 1345295 | 1041.06 | 5494 | 5280 | 1287.2 |
| D | 2 | 232 | 1308786 | 1012.69 | 5494 | 5280 | 1287.2 |
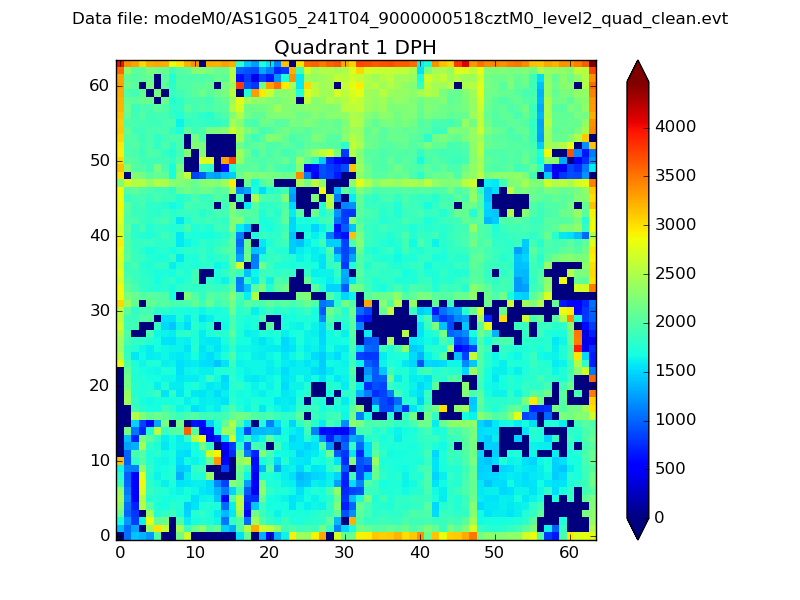
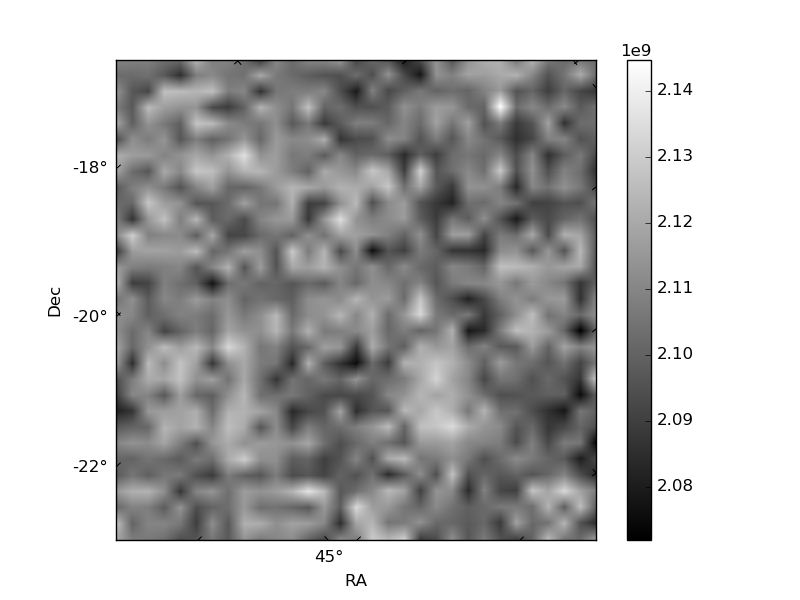
Histogram calculated using DETX and DETY for each event in the final _common_clean file
| Quadrant A |  |
 |
Quadrant B |
|---|---|---|---|
| Quadrant D |  |
 |
Quadrant C |
| Plot type | Count rate plots | Images |
|---|---|---|
| Comparison with Poisson distribution Blue bars denote a histogram of data divided into 1 sec bins. Red curve is a Poisson curve with rate = median count rate of data. |
 |
 |
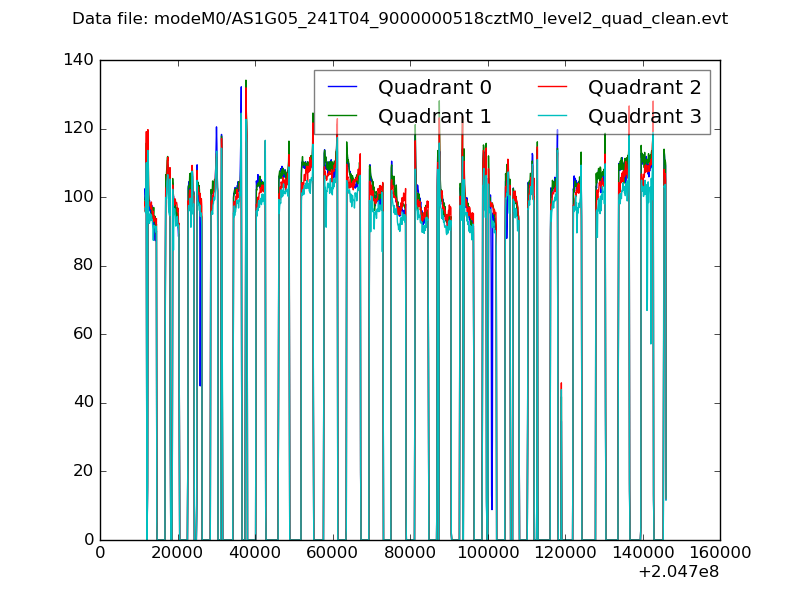
| Quadrant-wise count rates Data is divided into 100 sec bins |
 |
|
| Module-wise count rates for Quadrant A Data is divided into 100 sec bins |
 |
 |
| Module-wise count rates for Quadrant B Data is divided into 100 sec bins |
 |
 |
| Module-wise count rates for Quadrant C Data is divided into 100 sec bins |
 |
 |
| Module-wise count rates for Quadrant D Data is divided into 100 sec bins |
 |
 |
| Parameter | Plot |
|---|---|
| CZT HV Monitor |  |
| D_VDD | 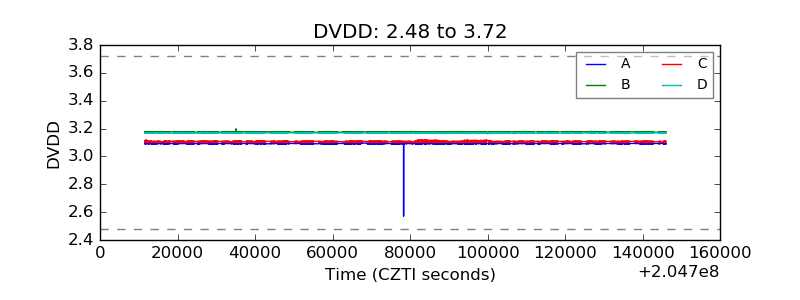 |
| Temperature 1 |  |
| Veto HV Monitor |  |
| Veto LLD | 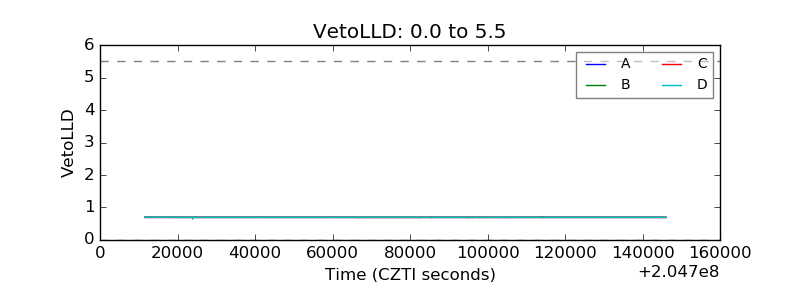 |
| Alpha Counter |  |
| _CPM_Rate |  |
| CZT Counter |  |
| +2.5 Volts monitor | 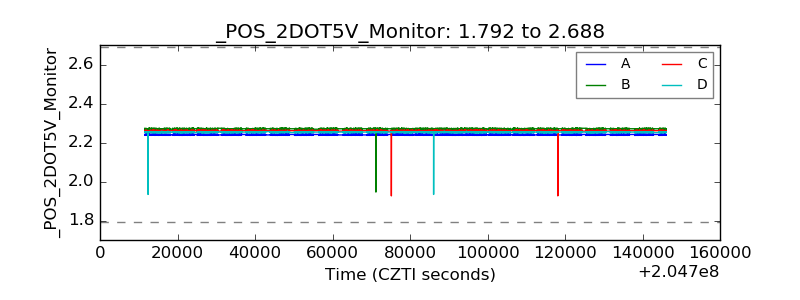 |
| +5 Volts monitor | 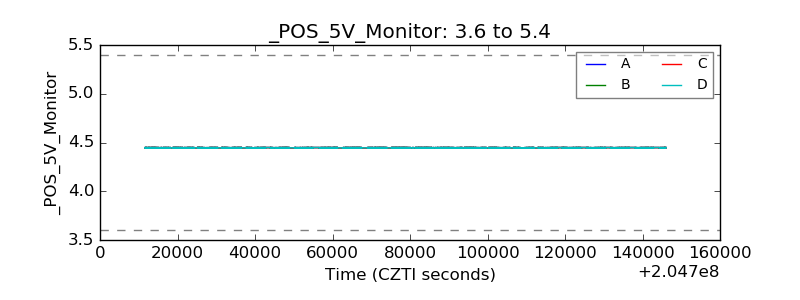 |
| _ROLL_ROT |  |
| _Roll_DEC |  |
| _Roll_RA |  |
| Veto Counter |  |