| Param | Original file | Final file |
|---|---|---|
| Filename | modeM0/AS1G05_246T03_9000000516cztM0_level2_bc.evt | modeM0/AS1G05_246T03_9000000516cztM0_level2_quad_clean.evt |
| Size (bytes) | 2,166,341,760 | 605,897,280 |
| Size | 2.0 GB | 577.8 MB |
| Events in quadrant A | 20,522,312 | 3,594,326 |
| Events in quadrant B | 14,211,637 | 3,676,184 |
| Events in quadrant C | 11,123,649 | 3,710,234 |
| Events in quadrant D | 15,897,777 | 3,491,842 |
| Mode SS | |||
|---|---|---|---|
| Quadrant | BADHDUFLAG | Total packets | Discarded packets |
| A | 0 | 1146 | 0 |
| B | 0 | 1144 | 0 |
| C | 0 | 1146 | 0 |
| D | 0 | 1146 | 0 |
| Mode M0 | |||
|---|---|---|---|
| Quadrant | BADHDUFLAG | Total packets | Discarded packets |
| A | 0 | 149821 | 0 |
| B | 0 | 126689 | 0 |
| C | 0 | 117178 | 0 |
| D | 0 | 134667 | 0 |
| Mode M9 | |||
|---|---|---|---|
| Quadrant | BADHDUFLAG | Total packets | Discarded packets |
| A | 0 | 94 | 0 |
| B | 0 | 94 | 0 |
| C | 0 | 94 | 0 |
| D | 0 | 94 | 0 |
| Quadrant | Total seconds | Saturated seconds | Saturation percentage |
|---|---|---|---|
| A | 56538 | 2458 | 4.347518% |
| B | 56549 | 1338 | 2.366090% |
| C | 56548 | 646 | 1.142392% |
| D | 56538 | 1859 | 3.288054% |
Noise dominated data is calculated using 1-second bins in cleaned event files. If a bin has >2000 counts, and if more than 50% of those come from <1% of pixels, then it is considered to be noise-dominated and hence unusable.
| Quadrant | # 1 sec bins | Bins with >0 counts | Bins with >2000 counts | High rate bins dominated by noise | Noise dominated (total time) | Noise dominated (detector-on time) | Marked lightcurve |
|---|---|---|---|---|---|---|---|
| A | 65687 | 56564 | 100 | 100 | 0.15% | 0.18% |  |
| B | 65687 | 56564 | 171 | 171 | 0.26% | 0.30% |  |
| C | 65687 | 56564 | 27 | 27 | 0.04% | 0.05% | 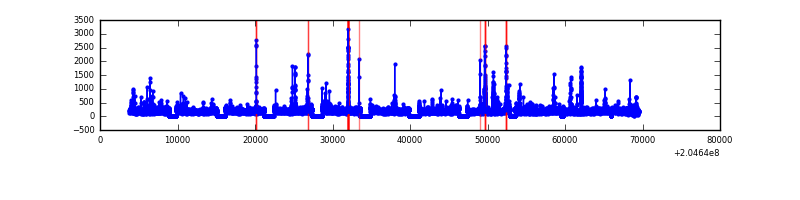 |
| D | 65687 | 56565 | 153 | 153 | 0.23% | 0.27% |  |
Top three noisy pixels from each quadrant. If the there are fewer than three noisy pixels in the level2.evt file, extra rows are filled as -1
| Pixel properties | Quadrant properties | ||||||
|---|---|---|---|---|---|---|---|
| Quadrant | DetID | PixID | Counts | Sigma | Mean | Median | Sigma |
| A | 8 | 15 | 4623328 | 7868.06 | 2634 | 2573 | 587.3 |
| A | 0 | 199 | 2792667 | 4750.87 | 2634 | 2573 | 587.3 |
| A | 0 | 50 | 1550972 | 2636.56 | 2634 | 2573 | 587.3 |
| B | 10 | 16 | 1488267 | 2825.79 | 2705 | 2625 | 525.7 |
| B | 14 | 167 | 988051 | 1874.35 | 2705 | 2625 | 525.7 |
| B | 15 | 204 | 534596 | 1011.84 | 2705 | 2625 | 525.7 |
| C | 9 | 144 | 215640 | 352.37 | 2683 | 2643 | 604.5 |
| C | 12 | 4 | 210613 | 344.05 | 2683 | 2643 | 604.5 |
| C | 1 | 16 | 137675 | 223.39 | 2683 | 2643 | 604.5 |
| D | 2 | 232 | 1557889 | 2502.89 | 2638 | 2537 | 621.4 |
| D | 11 | 132 | 1412390 | 2268.75 | 2638 | 2537 | 621.4 |
| D | 13 | 53 | 750093 | 1202.98 | 2638 | 2537 | 621.4 |
Histogram calculated using DETX and DETY for each event in the final _common_clean file
| Quadrant A |  |
 |
Quadrant B |
|---|---|---|---|
| Quadrant D |  |
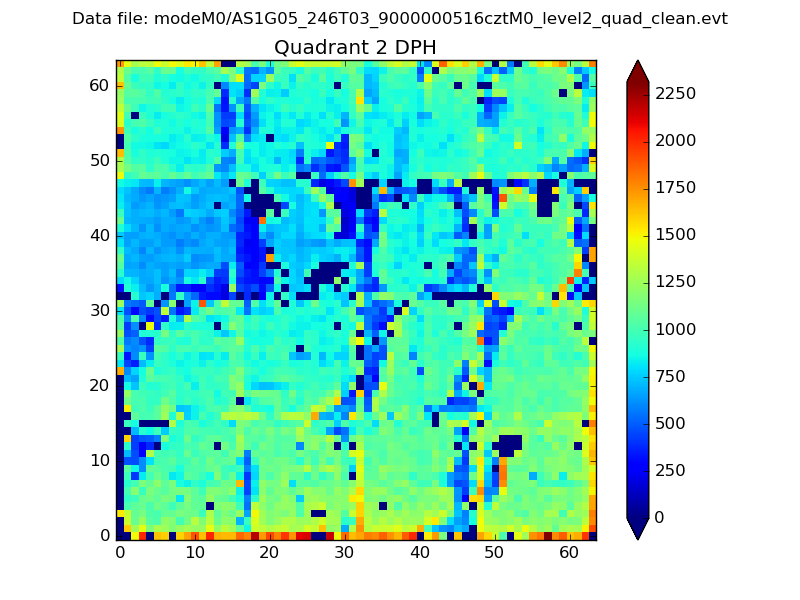 |
Quadrant C |
| Plot type | Count rate plots | Images |
|---|---|---|
| Comparison with Poisson distribution Blue bars denote a histogram of data divided into 1 sec bins. Red curve is a Poisson curve with rate = median count rate of data. |
 |
 |
| Quadrant-wise count rates Data is divided into 100 sec bins |
 |
|
| Module-wise count rates for Quadrant A Data is divided into 100 sec bins |
 |
 |
| Module-wise count rates for Quadrant B Data is divided into 100 sec bins |
 |
 |
| Module-wise count rates for Quadrant C Data is divided into 100 sec bins |
 |
 |
| Module-wise count rates for Quadrant D Data is divided into 100 sec bins |
 |
 |
| Parameter | Plot |
|---|---|
| CZT HV Monitor | 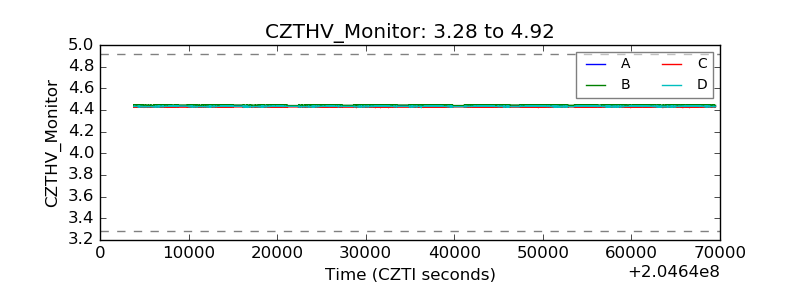 |
| D_VDD |  |
| Temperature 1 |  |
| Veto HV Monitor |  |
| Veto LLD |  |
| Alpha Counter |  |
| _CPM_Rate |  |
| CZT Counter | 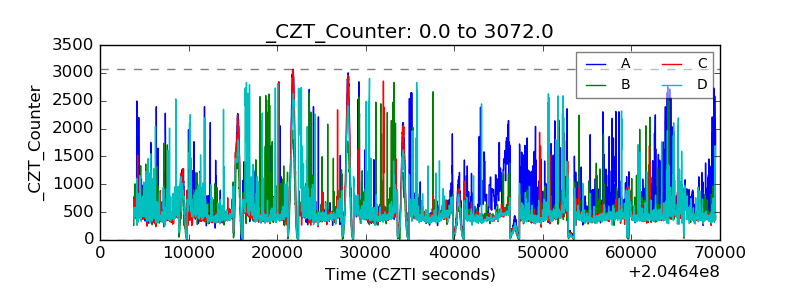 |
| +2.5 Volts monitor |  |
| +5 Volts monitor |  |
| _ROLL_ROT |  |
| _Roll_DEC |  |
| _Roll_RA |  |
| Veto Counter |  |