| Param | Original file | Final file |
|---|---|---|
| Filename | modeM0/AS1G05_173T01_9000000514cztM0_level2_bc.evt | modeM0/AS1G05_173T01_9000000514cztM0_level2_quad_clean.evt |
| Size (bytes) | 3,534,923,520 | 1,209,415,680 |
| Size | 3.3 GB | 1.1 GB |
| Events in quadrant A | 24,628,864 | 7,260,849 |
| Events in quadrant B | 23,879,187 | 7,328,618 |
| Events in quadrant C | 21,307,086 | 7,252,525 |
| Events in quadrant D | 29,457,244 | 6,966,014 |
| Mode M0 | |||
|---|---|---|---|
| Quadrant | BADHDUFLAG | Total packets | Discarded packets |
| A | 0 | 245082 | 0 |
| B | 0 | 238569 | 0 |
| C | 0 | 233626 | 0 |
| D | 0 | 257258 | 0 |
| Mode SS | |||
|---|---|---|---|
| Quadrant | BADHDUFLAG | Total packets | Discarded packets |
| A | 0 | 2322 | 0 |
| B | 0 | 2316 | 0 |
| C | 0 | 2322 | 0 |
| D | 0 | 2320 | 0 |
| Mode M9 | |||
|---|---|---|---|
| Quadrant | BADHDUFLAG | Total packets | Discarded packets |
| A | 0 | 155 | 0 |
| B | 0 | 155 | 0 |
| C | 0 | 155 | 0 |
| D | 0 | 156 | 0 |
| Quadrant | Total seconds | Saturated seconds | Saturation percentage |
|---|---|---|---|
| A | 114153 | 2708 | 2.372255% |
| B | 114169 | 1887 | 1.652813% |
| C | 114159 | 1378 | 1.207088% |
| D | 114150 | 2295 | 2.010512% |
Noise dominated data is calculated using 1-second bins in cleaned event files. If a bin has >2000 counts, and if more than 50% of those come from <1% of pixels, then it is considered to be noise-dominated and hence unusable.
| Quadrant | # 1 sec bins | Bins with >0 counts | Bins with >2000 counts | High rate bins dominated by noise | Noise dominated (total time) | Noise dominated (detector-on time) | Marked lightcurve |
|---|---|---|---|---|---|---|---|
| A | 128966 | 114235 | 71 | 71 | 0.06% | 0.06% |  |
| B | 128966 | 114236 | 44 | 44 | 0.03% | 0.04% | 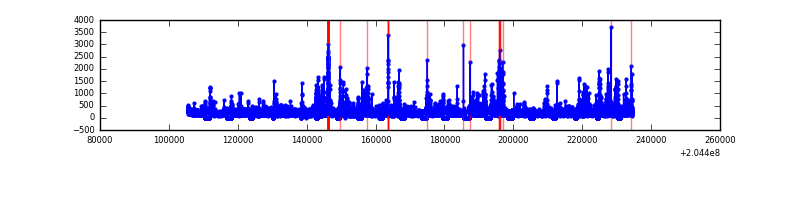 |
| C | 128967 | 114236 | 4 | 4 | 0.00% | 0.00% |  |
| D | 128967 | 114236 | 312 | 312 | 0.24% | 0.27% | 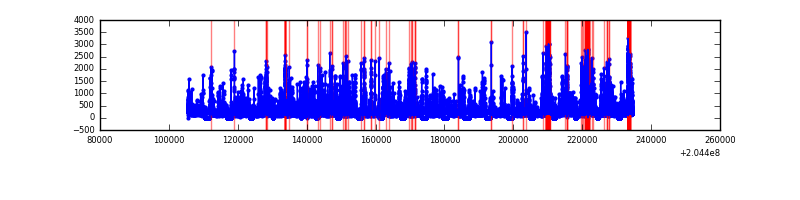 |
Top three noisy pixels from each quadrant. If the there are fewer than three noisy pixels in the level2.evt file, extra rows are filled as -1
| Pixel properties | Quadrant properties | ||||||
|---|---|---|---|---|---|---|---|
| Quadrant | DetID | PixID | Counts | Sigma | Mean | Median | Sigma |
| A | 0 | 50 | 1890608 | 1561.95 | 5424 | 5301 | 1207.0 |
| A | 0 | 118 | 856816 | 705.47 | 5424 | 5301 | 1207.0 |
| A | 8 | 15 | 214393 | 173.23 | 5424 | 5301 | 1207.0 |
| B | 15 | 204 | 734442 | 685.71 | 5493 | 5322 | 1063.3 |
| B | 14 | 167 | 651524 | 607.73 | 5493 | 5322 | 1063.3 |
| B | 4 | 81 | 562209 | 523.73 | 5493 | 5322 | 1063.3 |
| C | 9 | 144 | 161367 | 133.0 | 5318 | 5219 | 1174.1 |
| C | 12 | 4 | 79037 | 62.87 | 5318 | 5219 | 1174.1 |
| C | 8 | 128 | 58161 | 45.09 | 5318 | 5219 | 1174.1 |
| D | 11 | 132 | 3150193 | 2521.19 | 5334 | 5116 | 1247.5 |
| D | 2 | 232 | 1644313 | 1314.03 | 5334 | 5116 | 1247.5 |
| D | 2 | 63 | 815152 | 649.35 | 5334 | 5116 | 1247.5 |
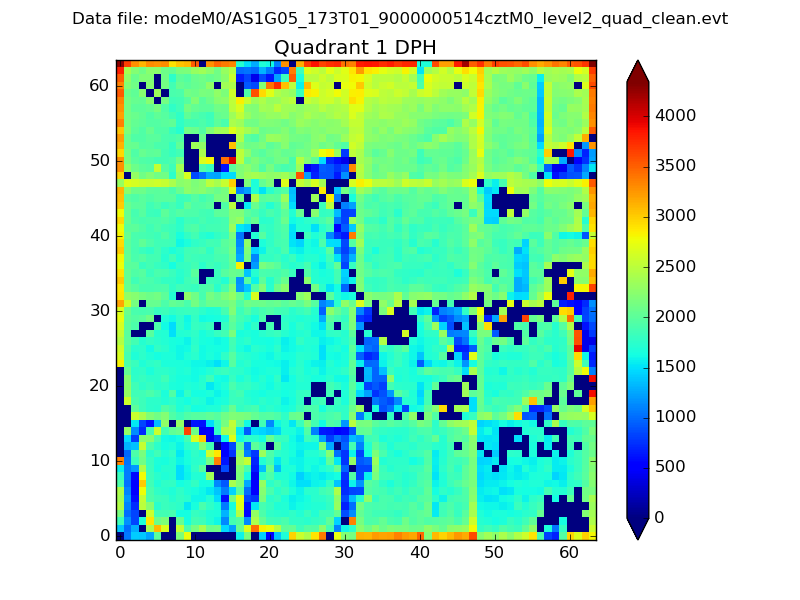
Histogram calculated using DETX and DETY for each event in the final _common_clean file
| Quadrant A |  |
 |
Quadrant B |
|---|---|---|---|
| Quadrant D |  |
 |
Quadrant C |
| Plot type | Count rate plots | Images |
|---|---|---|
| Comparison with Poisson distribution Blue bars denote a histogram of data divided into 1 sec bins. Red curve is a Poisson curve with rate = median count rate of data. |
 |
 |
| Quadrant-wise count rates Data is divided into 100 sec bins |
 |
|
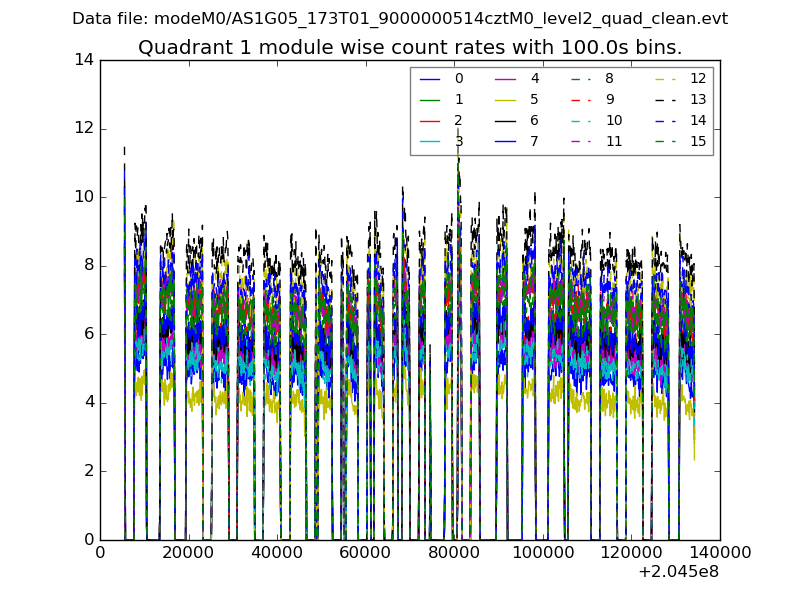
| Module-wise count rates for Quadrant A Data is divided into 100 sec bins |
 |
 |
| Module-wise count rates for Quadrant B Data is divided into 100 sec bins |
 |
 |
| Module-wise count rates for Quadrant C Data is divided into 100 sec bins |
 |
 |
| Module-wise count rates for Quadrant D Data is divided into 100 sec bins |
 |
 |
| Parameter | Plot |
|---|---|
| CZT HV Monitor |  |
| D_VDD |  |
| Temperature 1 |  |
| Veto HV Monitor |  |
| Veto LLD |  |
| Alpha Counter |  |
| _CPM_Rate |  |
| CZT Counter |  |
| +2.5 Volts monitor |  |
| +5 Volts monitor |  |
| _ROLL_ROT |  |
| _Roll_DEC |  |
| _Roll_RA |  |
| Veto Counter | 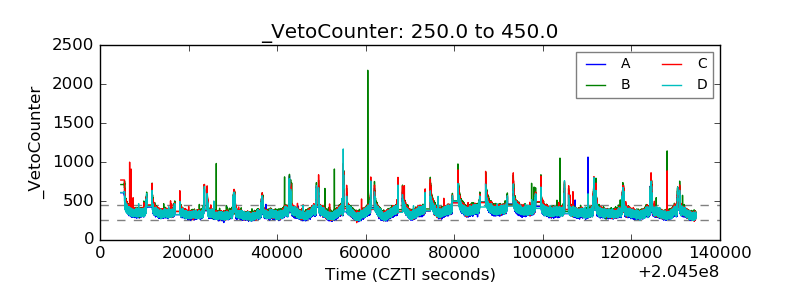 |