| Param | Original file | Final file |
|---|---|---|
| Filename | modeM0/AS1G05_247T01_9000000512cztM0_level2.evt | modeM0/AS1G05_247T01_9000000512cztM0_level2_quad_clean.evt |
| Size (bytes) | 10,580,284,800 | 2,661,088,320 |
| Size | 9.9 GB | 2.5 GB |
| Events in quadrant A | 79,925,780 | 17,670,840 |
| Events in quadrant B | 77,290,660 | 17,938,511 |
| Events in quadrant C | 65,577,644 | 17,808,521 |
| Events in quadrant D | 87,515,470 | 16,917,029 |
| Mode SS | |||
|---|---|---|---|
| Quadrant | BADHDUFLAG | Total packets | Discarded packets |
| A | 0 | 3054 | 0 |
| B | 0 | 3054 | 0 |
| C | 0 | 3054 | 0 |
| D | 0 | 3054 | 0 |
| Mode M0 | |||
|---|---|---|---|
| Quadrant | BADHDUFLAG | Total packets | Discarded packets |
| A | 0 | 343881 | 0 |
| B | 0 | 331566 | 0 |
| C | 0 | 306277 | 0 |
| D | 0 | 369953 | 0 |
| Quadrant | Total seconds | Saturated seconds | Saturation percentage |
|---|---|---|---|
| A | 149959 | 4722 | 3.148861% |
| B | 149959 | 2989 | 1.993211% |
| C | 149959 | 985 | 0.656846% |
| D | 149959 | 5413 | 3.609653% |
Noise dominated data is calculated using 1-second bins in cleaned event files. If a bin has >2000 counts, and if more than 50% of those come from <1% of pixels, then it is considered to be noise-dominated and hence unusable.
| Quadrant | # 1 sec bins | Bins with >0 counts | Bins with >2000 counts | High rate bins dominated by noise | Noise dominated (total time) | Noise dominated (detector-on time) | Marked lightcurve |
|---|---|---|---|---|---|---|---|
| A | 191974 | 149988 | 2307 | 2307 | 1.20% | 1.54% |  |
| B | 191974 | 149988 | 1170 | 1170 | 0.61% | 0.78% |  |
| C | 191974 | 149988 | 73 | 73 | 0.04% | 0.05% | 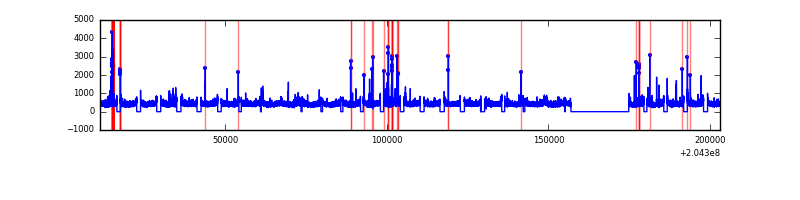 |
| D | 191974 | 149988 | 3931 | 3931 | 2.05% | 2.62% |  |
Top three noisy pixels from each quadrant. If the there are fewer than three noisy pixels in the level2.evt file, extra rows are filled as -1
| Pixel properties | Quadrant properties | ||||||
|---|---|---|---|---|---|---|---|
| Quadrant | DetID | PixID | Counts | Sigma | Mean | Median | Sigma |
| A | 0 | 50 | 10401963 | 3076.46 | 16718 | 16342 | 3375.8 |
| A | 4 | 48 | 1536460 | 450.29 | 16718 | 16342 | 3375.8 |
| A | 0 | 118 | 1500265 | 439.57 | 16718 | 16342 | 3375.8 |
| B | 14 | 167 | 6455668 | 2034.12 | 16977 | 16588 | 3165.5 |
| B | 15 | 204 | 1548522 | 483.94 | 16977 | 16588 | 3165.5 |
| B | 3 | 0 | 1267039 | 395.02 | 16977 | 16588 | 3165.5 |
| C | 9 | 144 | 1085315 | 285.44 | 16415 | 16452 | 3744.6 |
| C | 13 | 61 | 138421 | 32.57 | 16415 | 16452 | 3744.6 |
| C | 8 | 128 | 106696 | 24.1 | 16415 | 16452 | 3744.6 |
| D | 2 | 63 | 10120289 | 2641.73 | 16181 | 15720 | 3825.0 |
| D | 10 | 246 | 3411507 | 887.79 | 16181 | 15720 | 3825.0 |
| D | 9 | 82 | 3318324 | 863.43 | 16181 | 15720 | 3825.0 |
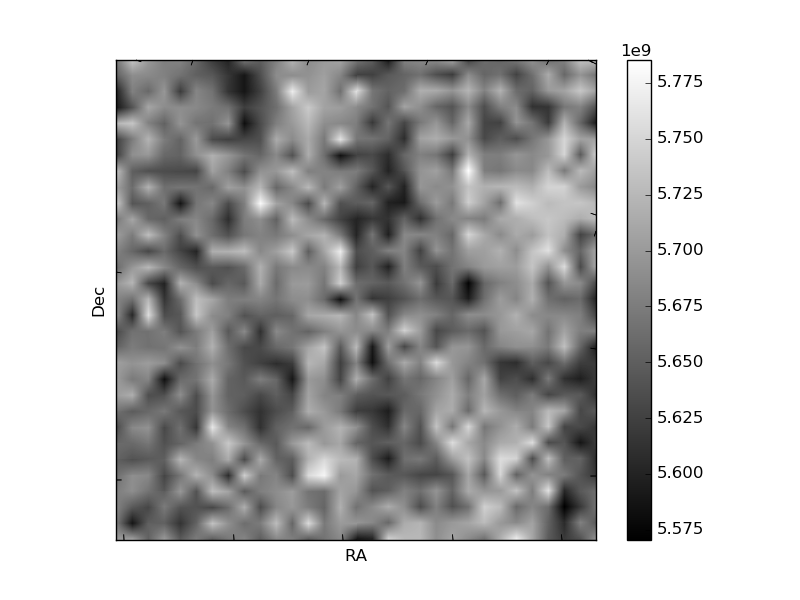
Histogram calculated using DETX and DETY for each event in the final _common_clean file
| Quadrant A |  |
 |
Quadrant B |
|---|---|---|---|
| Quadrant D |  |
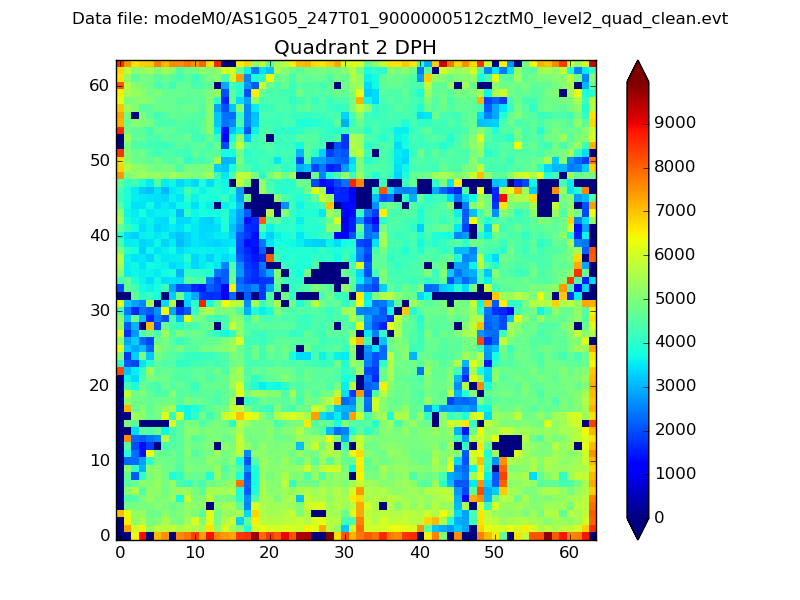 |
Quadrant C |
| Plot type | Count rate plots | Images |
|---|---|---|
| Comparison with Poisson distribution Blue bars denote a histogram of data divided into 1 sec bins. Red curve is a Poisson curve with rate = median count rate of data. |
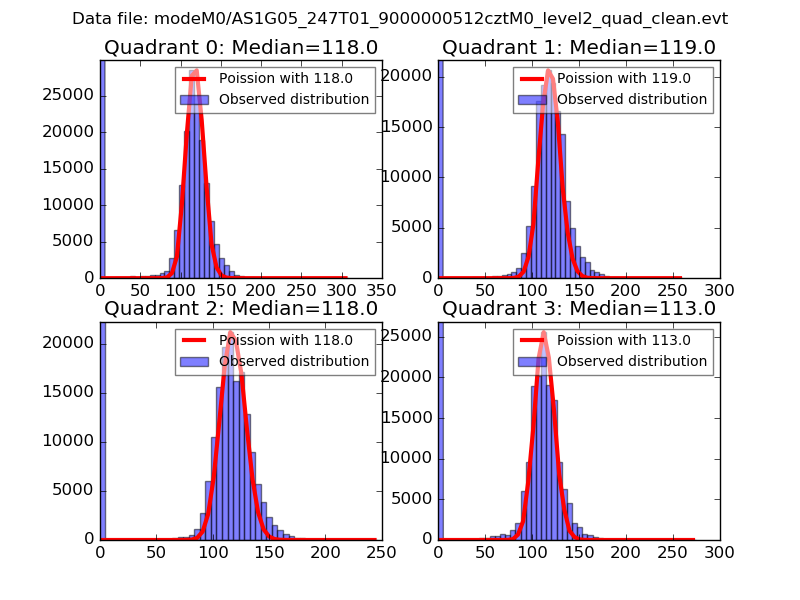 |
 |
| Quadrant-wise count rates Data is divided into 100 sec bins |
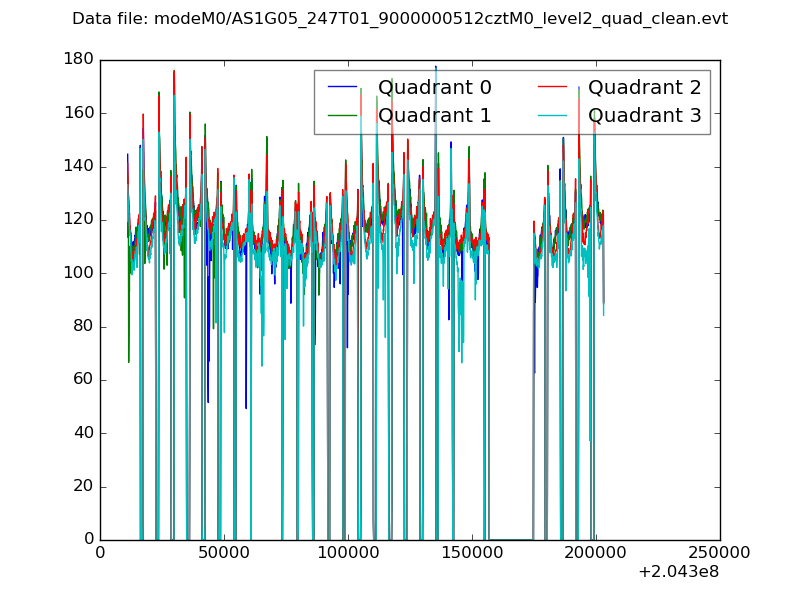 |
|
| Module-wise count rates for Quadrant A Data is divided into 100 sec bins |
 |
 |
| Module-wise count rates for Quadrant B Data is divided into 100 sec bins |
 |
 |
| Module-wise count rates for Quadrant C Data is divided into 100 sec bins |
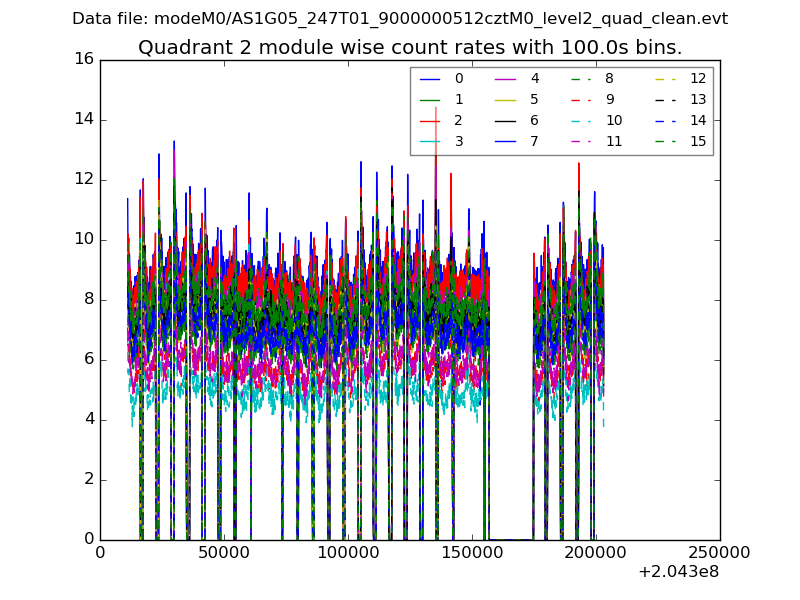 |
 |
| Module-wise count rates for Quadrant D Data is divided into 100 sec bins |
 |
 |
| Parameter | Plot |
|---|---|
| CZT HV Monitor |  |
| D_VDD |  |
| Temperature 1 |  |
| Veto HV Monitor |  |
| Veto LLD |  |
| Alpha Counter | 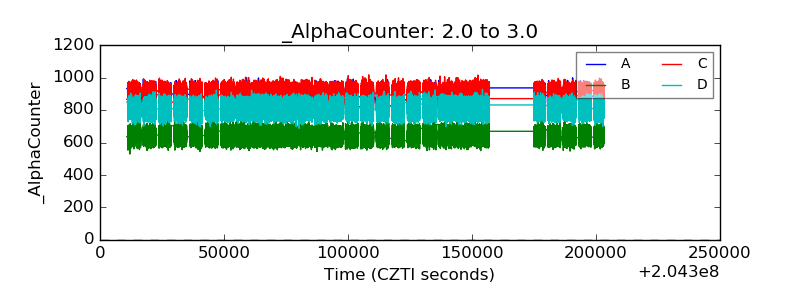 |
| _CPM_Rate |  |
| CZT Counter |  |
| +2.5 Volts monitor |  |
| +5 Volts monitor |  |
| _ROLL_ROT |  |
| _Roll_DEC |  |
| _Roll_RA |  |
| Veto Counter | 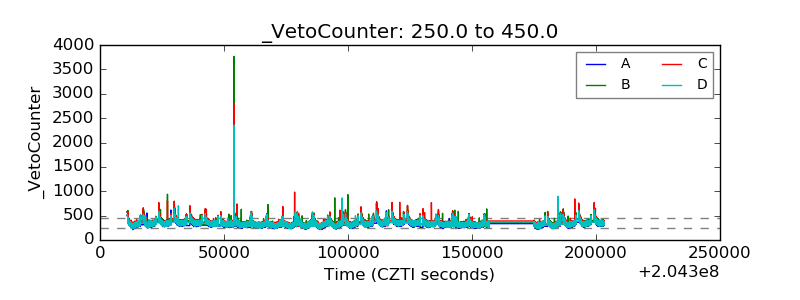 |