| Param | Original file | Final file |
|---|---|---|
| Filename | modeM0/AS1G05_170T01_9000000510cztM0_level2_bc.evt | modeM0/AS1G05_170T01_9000000510cztM0_level2_quad_clean.evt |
| Size (bytes) | 595,465,920 | 187,346,880 |
| Size | 567.9 MB | 178.7 MB |
| Events in quadrant A | 4,147,559 | 1,169,556 |
| Events in quadrant B | 5,860,490 | 1,159,893 |
| Events in quadrant C | 3,155,976 | 1,163,374 |
| Events in quadrant D | 3,822,583 | 1,127,140 |
| Mode SS | |||
|---|---|---|---|
| Quadrant | BADHDUFLAG | Total packets | Discarded packets |
| A | 0 | 310 | 0 |
| B | 0 | 310 | 0 |
| C | 0 | 310 | 0 |
| D | 0 | 310 | 0 |
| Mode M9 | |||
|---|---|---|---|
| Quadrant | BADHDUFLAG | Total packets | Discarded packets |
| A | 0 | 18 | 0 |
| B | 0 | 18 | 0 |
| C | 0 | 18 | 0 |
| D | 0 | 18 | 0 |
| Mode M0 | |||
|---|---|---|---|
| Quadrant | BADHDUFLAG | Total packets | Discarded packets |
| A | 0 | 35515 | 0 |
| B | 0 | 40090 | 0 |
| C | 0 | 32050 | 0 |
| D | 0 | 34804 | 0 |
| Quadrant | Total seconds | Saturated seconds | Saturation percentage |
|---|---|---|---|
| A | 15275 | 740 | 4.844517% |
| B | 15269 | 857 | 5.612679% |
| C | 15272 | 185 | 1.211367% |
| D | 15271 | 486 | 3.182503% |
Noise dominated data is calculated using 1-second bins in cleaned event files. If a bin has >2000 counts, and if more than 50% of those come from <1% of pixels, then it is considered to be noise-dominated and hence unusable.
| Quadrant | # 1 sec bins | Bins with >0 counts | Bins with >2000 counts | High rate bins dominated by noise | Noise dominated (total time) | Noise dominated (detector-on time) | Marked lightcurve |
|---|---|---|---|---|---|---|---|
| A | 17016 | 15277 | 64 | 64 | 0.38% | 0.42% | 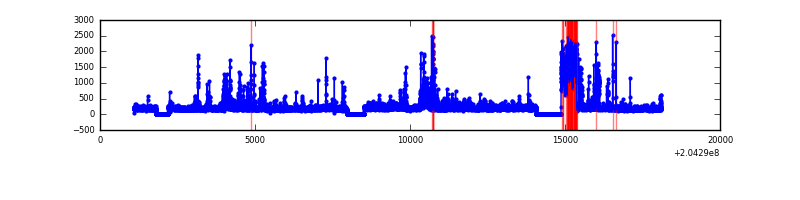 |
| B | 17016 | 15276 | 200 | 200 | 1.18% | 1.31% | 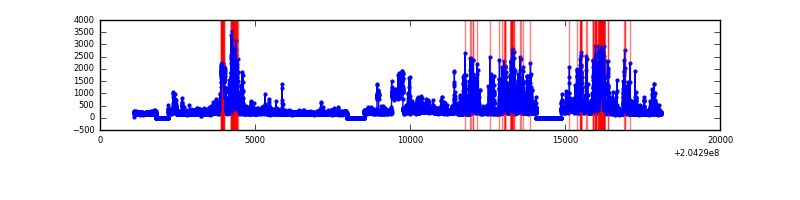 |
| C | 17016 | 15277 | 3 | 3 | 0.02% | 0.02% |  |
| D | 17016 | 15275 | 24 | 24 | 0.14% | 0.16% |  |
Top three noisy pixels from each quadrant. If the there are fewer than three noisy pixels in the level2.evt file, extra rows are filled as -1
| Pixel properties | Quadrant properties | ||||||
|---|---|---|---|---|---|---|---|
| Quadrant | DetID | PixID | Counts | Sigma | Mean | Median | Sigma |
| A | 15 | 236 | 809737 | 4989.71 | 705 | 689 | 162.1 |
| A | 0 | 50 | 337318 | 2076.12 | 705 | 689 | 162.1 |
| A | 0 | 118 | 114940 | 704.63 | 705 | 689 | 162.1 |
| B | 14 | 167 | 1788375 | 12796.27 | 708 | 687 | 139.7 |
| B | 3 | 0 | 759463 | 5431.32 | 708 | 687 | 139.7 |
| B | 15 | 204 | 323453 | 2310.36 | 708 | 687 | 139.7 |
| C | 9 | 144 | 395370 | 2496.07 | 695 | 681 | 158.1 |
| C | 8 | 128 | 13182 | 79.06 | 695 | 681 | 158.1 |
| C | 10 | 65 | 9634 | 56.62 | 695 | 681 | 158.1 |
| D | 2 | 232 | 766439 | 4614.99 | 694 | 666 | 165.9 |
| D | 2 | 32 | 106675 | 638.87 | 694 | 666 | 165.9 |
| D | 12 | 233 | 71794 | 428.66 | 694 | 666 | 165.9 |
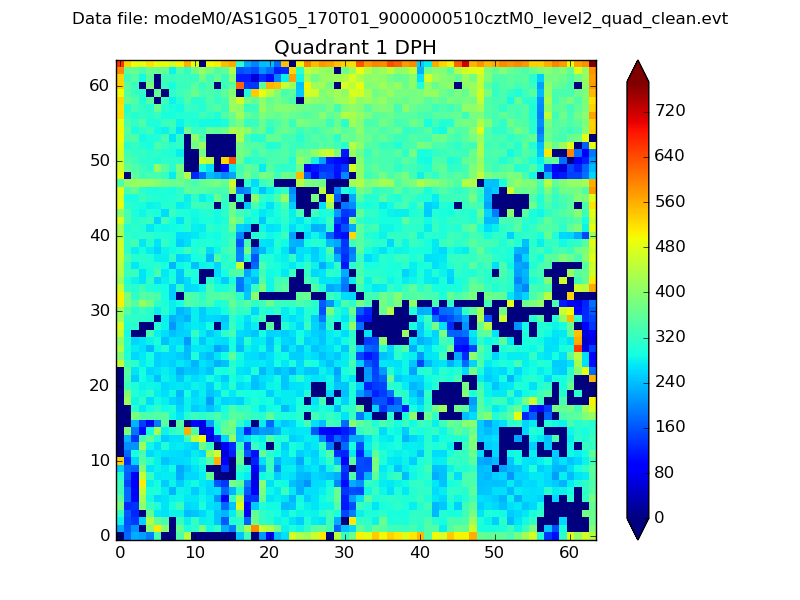
Histogram calculated using DETX and DETY for each event in the final _common_clean file
| Quadrant A |  |
 |
Quadrant B |
|---|---|---|---|
| Quadrant D |  |
 |
Quadrant C |
| Plot type | Count rate plots | Images |
|---|---|---|
| Comparison with Poisson distribution Blue bars denote a histogram of data divided into 1 sec bins. Red curve is a Poisson curve with rate = median count rate of data. |
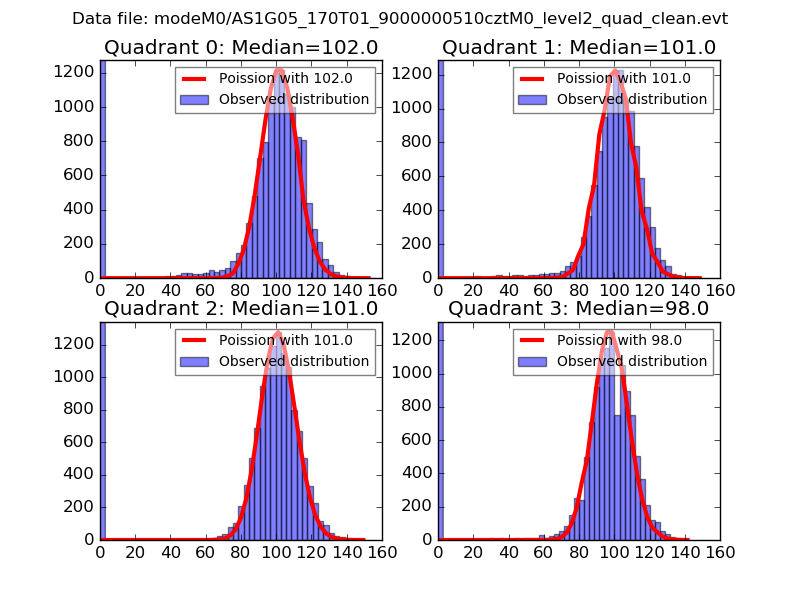 |
 |
| Quadrant-wise count rates Data is divided into 100 sec bins |
 |
|
| Module-wise count rates for Quadrant A Data is divided into 100 sec bins |
 |
 |
| Module-wise count rates for Quadrant B Data is divided into 100 sec bins |
 |
 |
| Module-wise count rates for Quadrant C Data is divided into 100 sec bins |
 |
 |
| Module-wise count rates for Quadrant D Data is divided into 100 sec bins |
 |
 |
| Parameter | Plot |
|---|---|
| CZT HV Monitor |  |
| D_VDD |  |
| Temperature 1 | 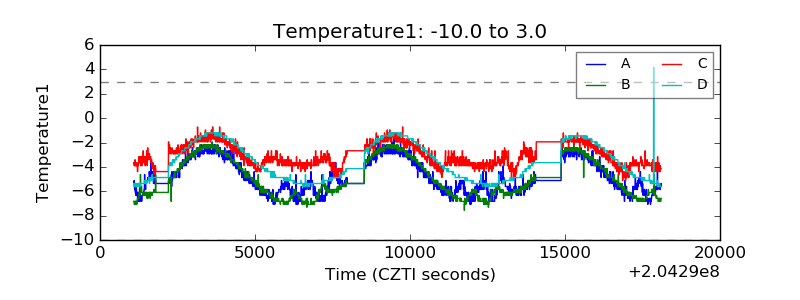 |
| Veto HV Monitor |  |
| Veto LLD |  |
| Alpha Counter |  |
| _CPM_Rate |  |
| CZT Counter |  |
| +2.5 Volts monitor |  |
| +5 Volts monitor | 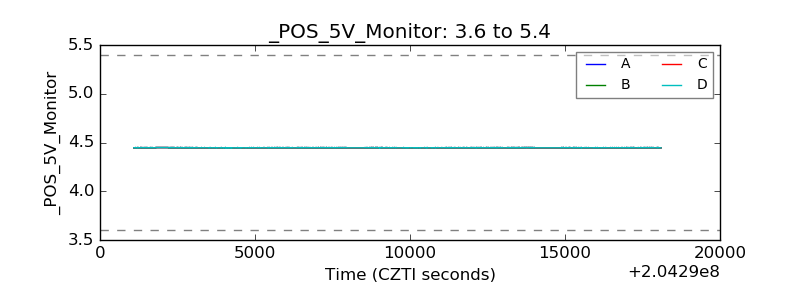 |
| _ROLL_ROT | 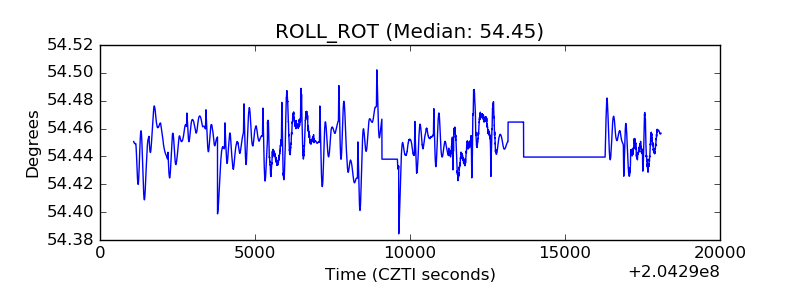 |
| _Roll_DEC |  |
| _Roll_RA |  |
| Veto Counter | 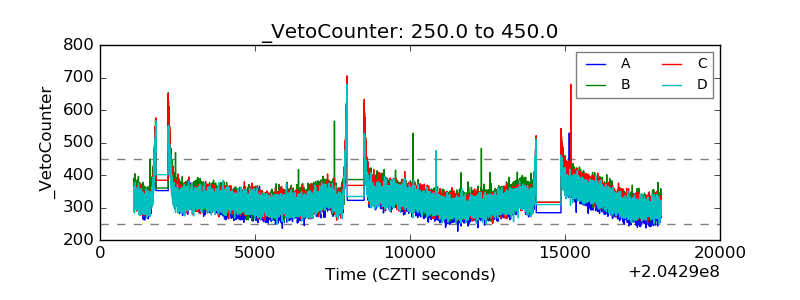 |