| Param | Original file | Final file |
|---|---|---|
| Filename | modeM0/AS1G05_229T02_9000000508cztM0_level2_bc.evt | modeM0/AS1G05_229T02_9000000508cztM0_level2_quad_clean.evt |
| Size (bytes) | 1,530,002,880 | 460,016,640 |
| Size | 1.4 GB | 438.7 MB |
| Events in quadrant A | 10,398,057 | 2,751,511 |
| Events in quadrant B | 11,681,421 | 2,751,322 |
| Events in quadrant C | 8,967,884 | 2,732,994 |
| Events in quadrant D | 12,219,079 | 2,609,410 |
| Mode SS | |||
|---|---|---|---|
| Quadrant | BADHDUFLAG | Total packets | Discarded packets |
| A | 0 | 916 | 0 |
| B | 0 | 916 | 0 |
| C | 0 | 916 | 0 |
| D | 0 | 916 | 0 |
| Mode M9 | |||
|---|---|---|---|
| Quadrant | BADHDUFLAG | Total packets | Discarded packets |
| A | 0 | 69 | 0 |
| B | 0 | 69 | 0 |
| C | 0 | 69 | 0 |
| D | 0 | 69 | 0 |
| Mode M0 | |||
|---|---|---|---|
| Quadrant | BADHDUFLAG | Total packets | Discarded packets |
| A | 0 | 98359 | 0 |
| B | 0 | 100429 | 0 |
| C | 0 | 93479 | 0 |
| D | 0 | 103849 | 0 |
| Quadrant | Total seconds | Saturated seconds | Saturation percentage |
|---|---|---|---|
| A | 44984 | 1066 | 2.369731% |
| B | 44984 | 996 | 2.214121% |
| C | 44983 | 652 | 1.449436% |
| D | 44984 | 1197 | 2.660946% |
Noise dominated data is calculated using 1-second bins in cleaned event files. If a bin has >2000 counts, and if more than 50% of those come from <1% of pixels, then it is considered to be noise-dominated and hence unusable.
| Quadrant | # 1 sec bins | Bins with >0 counts | Bins with >2000 counts | High rate bins dominated by noise | Noise dominated (total time) | Noise dominated (detector-on time) | Marked lightcurve |
|---|---|---|---|---|---|---|---|
| A | 51820 | 44986 | 6 | 6 | 0.01% | 0.01% |  |
| B | 51820 | 44986 | 16 | 16 | 0.03% | 0.04% |  |
| C | 51820 | 44988 | 2 | 2 | 0.00% | 0.00% |  |
| D | 51820 | 44988 | 77 | 77 | 0.15% | 0.17% |  |
Top three noisy pixels from each quadrant. If the there are fewer than three noisy pixels in the level2.evt file, extra rows are filled as -1
| Pixel properties | Quadrant properties | ||||||
|---|---|---|---|---|---|---|---|
| Quadrant | DetID | PixID | Counts | Sigma | Mean | Median | Sigma |
| A | 0 | 118 | 858811 | 1757.61 | 2198 | 2147 | 487.4 |
| A | 8 | 15 | 381349 | 778.01 | 2198 | 2147 | 487.4 |
| A | 0 | 50 | 361579 | 737.44 | 2198 | 2147 | 487.4 |
| B | 15 | 204 | 1181670 | 2767.74 | 2223 | 2156 | 426.2 |
| B | 3 | 0 | 776492 | 1816.98 | 2223 | 2156 | 426.2 |
| B | 4 | 81 | 279748 | 651.37 | 2223 | 2156 | 426.2 |
| C | 14 | 234 | 213617 | 444.92 | 2151 | 2112 | 475.4 |
| C | 9 | 144 | 193313 | 402.21 | 2151 | 2112 | 475.4 |
| C | 8 | 128 | 41428 | 82.7 | 2151 | 2112 | 475.4 |
| D | 10 | 246 | 1065974 | 2139.41 | 2138 | 2052 | 497.3 |
| D | 2 | 232 | 1045618 | 2098.48 | 2138 | 2052 | 497.3 |
| D | 2 | 63 | 777899 | 1560.13 | 2138 | 2052 | 497.3 |
Histogram calculated using DETX and DETY for each event in the final _common_clean file
| Quadrant A |  |
 |
Quadrant B |
|---|---|---|---|
| Quadrant D |  |
 |
Quadrant C |
| Plot type | Count rate plots | Images |
|---|---|---|
| Comparison with Poisson distribution Blue bars denote a histogram of data divided into 1 sec bins. Red curve is a Poisson curve with rate = median count rate of data. |
 |
 |
| Quadrant-wise count rates Data is divided into 100 sec bins |
 |
|
| Module-wise count rates for Quadrant A Data is divided into 100 sec bins |
 |
 |
| Module-wise count rates for Quadrant B Data is divided into 100 sec bins |
 |
 |
| Module-wise count rates for Quadrant C Data is divided into 100 sec bins |
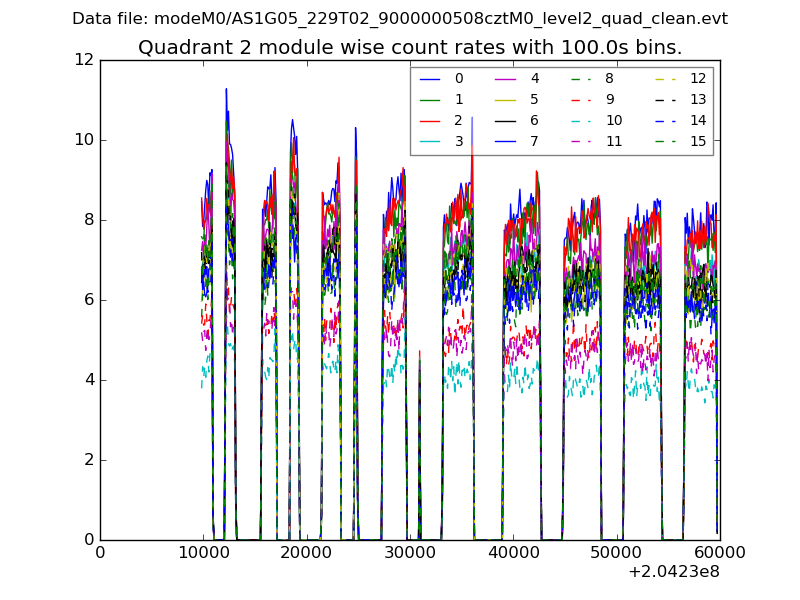 |
 |
| Module-wise count rates for Quadrant D Data is divided into 100 sec bins |
 |
 |
| Parameter | Plot |
|---|---|
| CZT HV Monitor |  |
| D_VDD |  |
| Temperature 1 |  |
| Veto HV Monitor |  |
| Veto LLD |  |
| Alpha Counter |  |
| _CPM_Rate |  |
| CZT Counter |  |
| +2.5 Volts monitor |  |
| +5 Volts monitor |  |
| _ROLL_ROT |  |
| _Roll_DEC |  |
| _Roll_RA |  |
| Veto Counter |  |