| Param | Original file | Final file |
|---|---|---|
| Filename | modeM0/AS1G05_246T02_9000000504cztM0_level2.evt | modeM0/AS1G05_246T02_9000000504cztM0_level2_quad_clean.evt |
| Size (bytes) | 4,263,523,200 | 679,584,960 |
| Size | 4.0 GB | 648.1 MB |
| Events in quadrant A | 37,572,646 | 4,042,766 |
| Events in quadrant B | 29,376,500 | 4,096,524 |
| Events in quadrant C | 25,519,612 | 4,045,791 |
| Events in quadrant D | 32,804,493 | 4,482,539 |
| Mode M0 | |||
|---|---|---|---|
| Quadrant | BADHDUFLAG | Total packets | Discarded packets |
| A | 0 | 149773 | 0 |
| B | 0 | 123818 | 0 |
| C | 0 | 117171 | 0 |
| D | 0 | 138125 | 0 |
| Mode SS | |||
|---|---|---|---|
| Quadrant | BADHDUFLAG | Total packets | Discarded packets |
| A | 0 | 1158 | 0 |
| B | 0 | 1158 | 0 |
| C | 0 | 1158 | 0 |
| D | 0 | 1158 | 0 |
| Mode M9 | |||
|---|---|---|---|
| Quadrant | BADHDUFLAG | Total packets | Discarded packets |
| A | 0 | 70 | 0 |
| B | 0 | 70 | 0 |
| C | 0 | 70 | 0 |
| D | 0 | 71 | 0 |
| Quadrant | Total seconds | Saturated seconds | Saturation percentage |
|---|---|---|---|
| A | 57094 | 1676 | 2.935510% |
| B | 57092 | 986 | 1.727037% |
| C | 57091 | 625 | 1.094743% |
| D | 57090 | 2060 | 3.608338% |
Noise dominated data is calculated using 1-second bins in cleaned event files. If a bin has >2000 counts, and if more than 50% of those come from <1% of pixels, then it is considered to be noise-dominated and hence unusable.
| Quadrant | # 1 sec bins | Bins with >0 counts | Bins with >2000 counts | High rate bins dominated by noise | Noise dominated (total time) | Noise dominated (detector-on time) | Marked lightcurve |
|---|---|---|---|---|---|---|---|
| A | 74236 | 57107 | 420 | 420 | 0.57% | 0.74% |  |
| B | 74236 | 57107 | 82 | 82 | 0.11% | 0.14% | 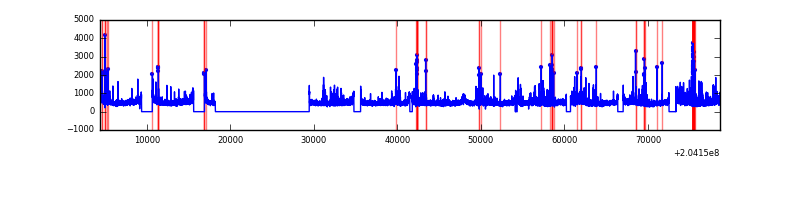 |
| C | 74236 | 57107 | 12 | 12 | 0.02% | 0.02% |  |
| D | 74236 | 57107 | 1184 | 1184 | 1.59% | 2.07% |  |
Top three noisy pixels from each quadrant. If the there are fewer than three noisy pixels in the level2.evt file, extra rows are filled as -1
| Pixel properties | Quadrant properties | ||||||
|---|---|---|---|---|---|---|---|
| Quadrant | DetID | PixID | Counts | Sigma | Mean | Median | Sigma |
| A | 4 | 48 | 4930955 | 3658.94 | 6632 | 6491 | 1345.9 |
| A | 8 | 15 | 2010915 | 1489.31 | 6632 | 6491 | 1345.9 |
| A | 0 | 118 | 1893318 | 1401.94 | 6632 | 6491 | 1345.9 |
| B | 15 | 204 | 1081156 | 836.53 | 6737 | 6588 | 1284.5 |
| B | 3 | 0 | 680935 | 524.97 | 6737 | 6588 | 1284.5 |
| B | 4 | 81 | 608213 | 468.36 | 6737 | 6588 | 1284.5 |
| C | 1 | 16 | 168282 | 108.3 | 6453 | 6475 | 1494.0 |
| C | 10 | 65 | 134934 | 85.98 | 6453 | 6475 | 1494.0 |
| C | 13 | 61 | 54791 | 32.34 | 6453 | 6475 | 1494.0 |
| D | 2 | 232 | 3925335 | 2545.72 | 6360 | 6171 | 1539.5 |
| D | 2 | 63 | 1908423 | 1235.62 | 6360 | 6171 | 1539.5 |
| D | 12 | 233 | 523569 | 336.08 | 6360 | 6171 | 1539.5 |
Histogram calculated using DETX and DETY for each event in the final _common_clean file
| Quadrant A |  |
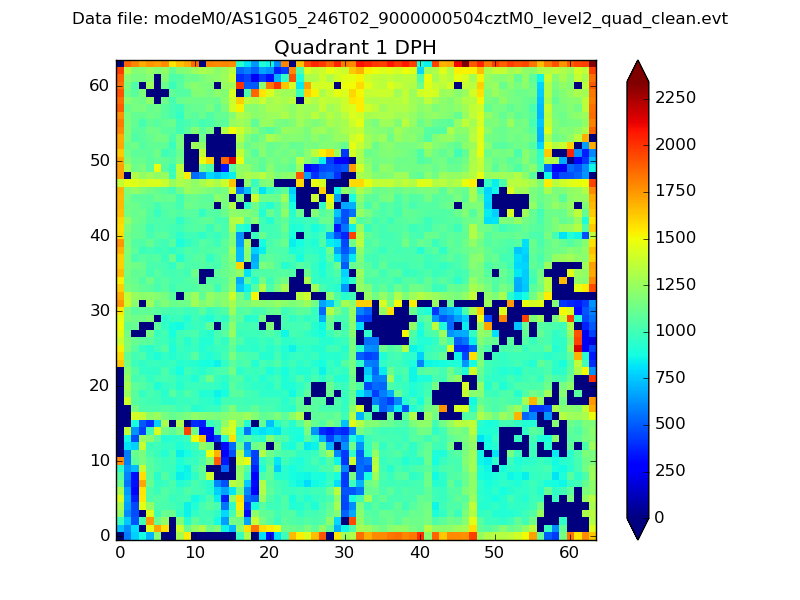 |
Quadrant B |
|---|---|---|---|
| Quadrant D |  |
 |
Quadrant C |
| Plot type | Count rate plots | Images |
|---|---|---|
| Comparison with Poisson distribution Blue bars denote a histogram of data divided into 1 sec bins. Red curve is a Poisson curve with rate = median count rate of data. |
 |
 |
| Quadrant-wise count rates Data is divided into 100 sec bins |
 |
|
| Module-wise count rates for Quadrant A Data is divided into 100 sec bins |
 |
 |
| Module-wise count rates for Quadrant B Data is divided into 100 sec bins |
 |
 |
| Module-wise count rates for Quadrant C Data is divided into 100 sec bins |
 |
 |
| Module-wise count rates for Quadrant D Data is divided into 100 sec bins |
 |
 |
| Parameter | Plot |
|---|---|
| CZT HV Monitor |  |
| D_VDD |  |
| Temperature 1 |  |
| Veto HV Monitor |  |
| Veto LLD |  |
| Alpha Counter |  |
| _CPM_Rate |  |
| CZT Counter |  |
| +2.5 Volts monitor |  |
| +5 Volts monitor |  |
| _ROLL_ROT |  |
| _Roll_DEC |  |
| _Roll_RA |  |
| Veto Counter |  |