| Param | Original file | Final file |
|---|---|---|
| Filename | modeM0/AS1G05_172T01_9000000502cztM0_level2.evt | modeM0/AS1G05_172T01_9000000502cztM0_level2_quad_clean.evt |
| Size (bytes) | 15,509,131,200 | 2,618,320,320 |
| Size | 14.4 GB | 2.4 GB |
| Events in quadrant A | 110,355,291 | 16,313,532 |
| Events in quadrant B | 114,365,753 | 16,530,646 |
| Events in quadrant C | 94,846,687 | 16,423,764 |
| Events in quadrant D | 135,743,475 | 15,421,314 |
| Mode M0 | |||
|---|---|---|---|
| Quadrant | BADHDUFLAG | Total packets | Discarded packets |
| A | 0 | 472552 | 0 |
| B | 0 | 477360 | 0 |
| C | 0 | 438080 | 0 |
| D | 0 | 555928 | 0 |
| Mode M9 | |||
|---|---|---|---|
| Quadrant | BADHDUFLAG | Total packets | Discarded packets |
| A | 0 | 307 | 0 |
| B | 0 | 307 | 0 |
| C | 0 | 307 | 0 |
| D | 0 | 308 | 0 |
| Mode SS | |||
|---|---|---|---|
| Quadrant | BADHDUFLAG | Total packets | Discarded packets |
| A | 0 | 4340 | 0 |
| B | 0 | 4340 | 0 |
| C | 0 | 4338 | 0 |
| D | 0 | 4334 | 0 |
| Quadrant | Total seconds | Saturated seconds | Saturation percentage |
|---|---|---|---|
| A | 213418 | 4456 | 2.087921% |
| B | 213415 | 3597 | 1.685449% |
| C | 213410 | 1683 | 0.788623% |
| D | 213373 | 10595 | 4.965483% |
Noise dominated data is calculated using 1-second bins in cleaned event files. If a bin has >2000 counts, and if more than 50% of those come from <1% of pixels, then it is considered to be noise-dominated and hence unusable.
| Quadrant | # 1 sec bins | Bins with >0 counts | Bins with >2000 counts | High rate bins dominated by noise | Noise dominated (total time) | Noise dominated (detector-on time) | Marked lightcurve |
|---|---|---|---|---|---|---|---|
| A | 245174 | 213563 | 1344 | 1344 | 0.55% | 0.63% |  |
| B | 245174 | 213558 | 687 | 687 | 0.28% | 0.32% |  |
| C | 245174 | 213563 | 104 | 104 | 0.04% | 0.05% | 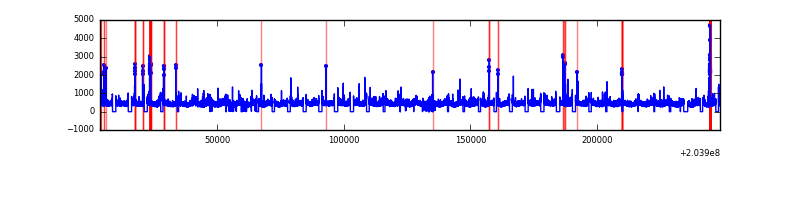 |
| D | 245174 | 213550 | 8247 | 8247 | 3.36% | 3.86% |  |
Top three noisy pixels from each quadrant. If the there are fewer than three noisy pixels in the level2.evt file, extra rows are filled as -1
| Pixel properties | Quadrant properties | ||||||
|---|---|---|---|---|---|---|---|
| Quadrant | DetID | PixID | Counts | Sigma | Mean | Median | Sigma |
| A | 0 | 118 | 5146427 | 1029.23 | 24585 | 24083 | 4976.9 |
| A | 8 | 15 | 4914430 | 982.61 | 24585 | 24083 | 4976.9 |
| A | 0 | 50 | 2921871 | 582.25 | 24585 | 24083 | 4976.9 |
| B | 3 | 0 | 7426689 | 1574.08 | 24860 | 24279 | 4702.7 |
| B | 15 | 204 | 5220746 | 1105.0 | 24860 | 24279 | 4702.7 |
| B | 10 | 16 | 1414595 | 295.64 | 24860 | 24279 | 4702.7 |
| C | 10 | 65 | 553834 | 96.6 | 23845 | 23928 | 5485.5 |
| C | 9 | 247 | 333119 | 56.37 | 23845 | 23928 | 5485.5 |
| C | 1 | 16 | 276544 | 46.05 | 23845 | 23928 | 5485.5 |
| D | 9 | 82 | 14766559 | 2644.98 | 23399 | 22725 | 5574.3 |
| D | 2 | 232 | 12556154 | 2248.44 | 23399 | 22725 | 5574.3 |
| D | 2 | 63 | 4432269 | 791.05 | 23399 | 22725 | 5574.3 |
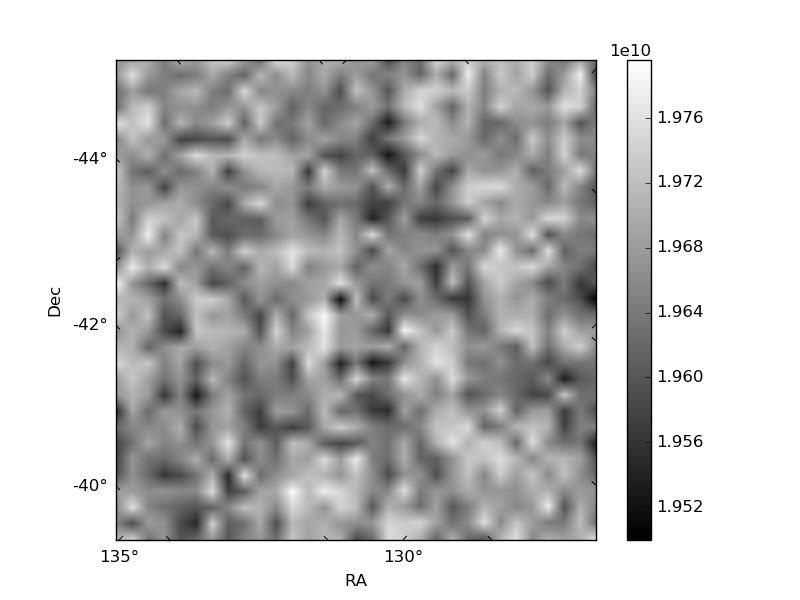
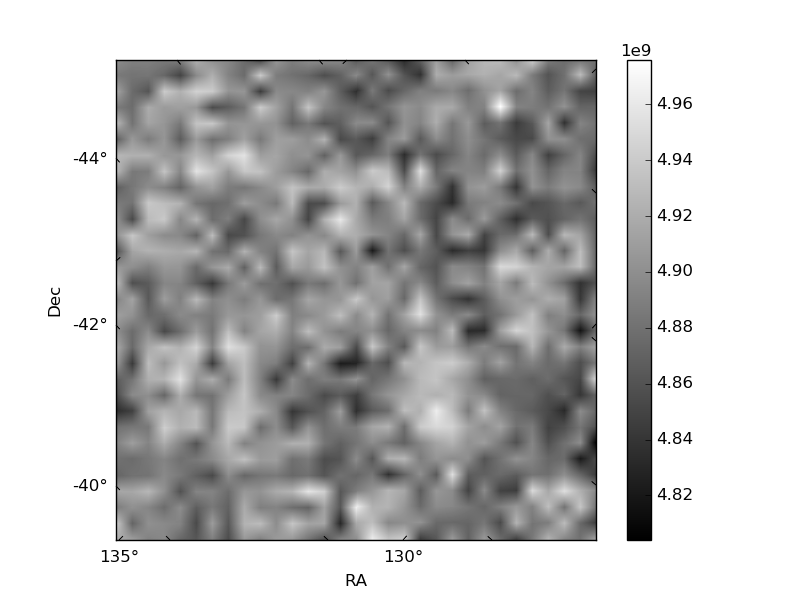
Histogram calculated using DETX and DETY for each event in the final _common_clean file
| Quadrant A |  |
 |
Quadrant B |
|---|---|---|---|
| Quadrant D |  |
 |
Quadrant C |
| Plot type | Count rate plots | Images |
|---|---|---|
| Comparison with Poisson distribution Blue bars denote a histogram of data divided into 1 sec bins. Red curve is a Poisson curve with rate = median count rate of data. |
 |
 |
| Quadrant-wise count rates Data is divided into 100 sec bins |
 |
|
| Module-wise count rates for Quadrant A Data is divided into 100 sec bins |
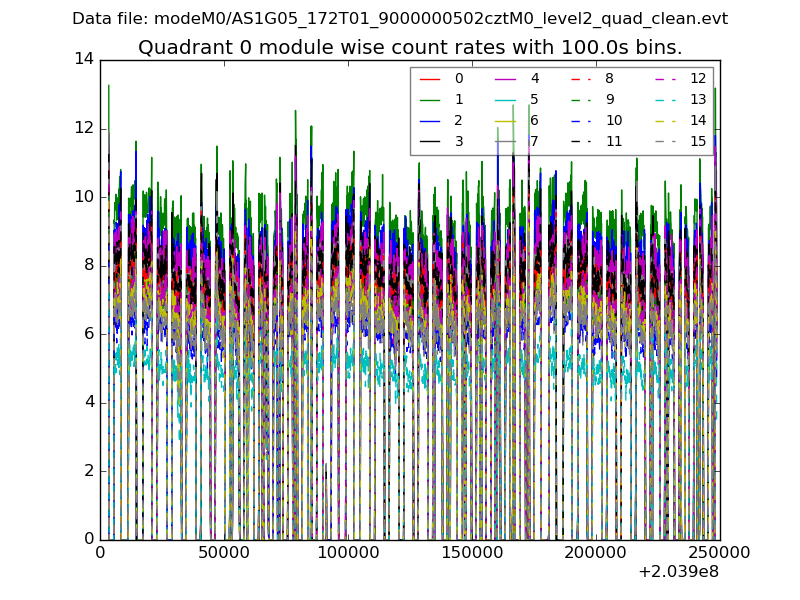 |
 |
| Module-wise count rates for Quadrant B Data is divided into 100 sec bins |
 |
 |
| Module-wise count rates for Quadrant C Data is divided into 100 sec bins |
 |
 |
| Module-wise count rates for Quadrant D Data is divided into 100 sec bins |
 |
 |
| Parameter | Plot |
|---|---|
| CZT HV Monitor |  |
| D_VDD |  |
| Temperature 1 |  |
| Veto HV Monitor |  |
| Veto LLD |  |
| Alpha Counter |  |
| _CPM_Rate | 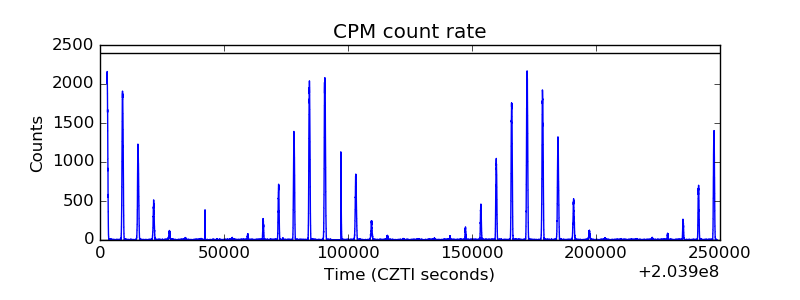 |
| CZT Counter |  |
| +2.5 Volts monitor | 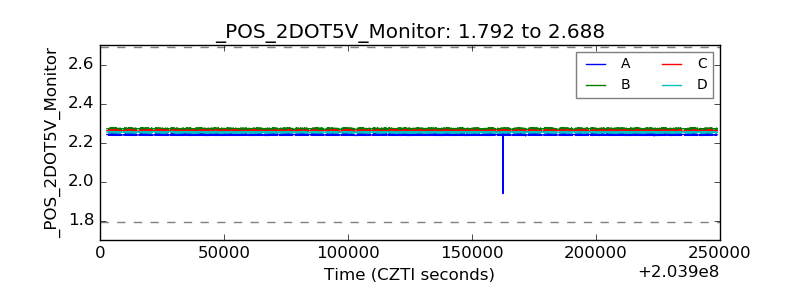 |
| +5 Volts monitor | 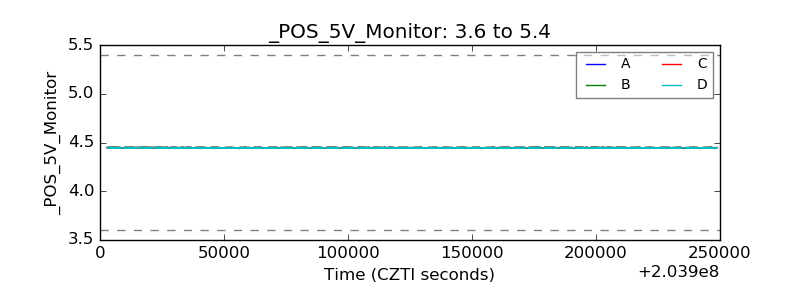 |
| _ROLL_ROT | 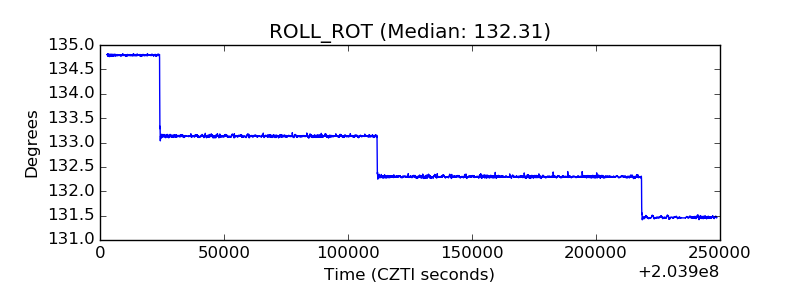 |
| _Roll_DEC |  |
| _Roll_RA |  |
| Veto Counter |  |