| Param | Original file | Final file |
|---|---|---|
| Filename | modeM0/AS1G05_083T02_9000000498cztM0_level2_bc.evt | modeM0/AS1G05_083T02_9000000498cztM0_level2_quad_clean.evt |
| Size (bytes) | 1,076,826,240 | 318,548,160 |
| Size | 1.0 GB | 303.8 MB |
| Events in quadrant A | 5,939,473 | 2,022,140 |
| Events in quadrant B | 7,875,662 | 1,989,798 |
| Events in quadrant C | 10,695,202 | 1,860,847 |
| Events in quadrant D | 6,276,518 | 1,939,535 |
| Mode M9 | |||
|---|---|---|---|
| Quadrant | BADHDUFLAG | Total packets | Discarded packets |
| A | 0 | 12 | 0 |
| B | 0 | 12 | 0 |
| C | 0 | 12 | 0 |
| D | 0 | 12 | 0 |
| Mode M0 | |||
|---|---|---|---|
| Quadrant | BADHDUFLAG | Total packets | Discarded packets |
| A | 0 | 57607 | 0 |
| B | 0 | 63012 | 0 |
| C | 0 | 84219 | 0 |
| D | 0 | 59005 | 0 |
| Mode SS | |||
|---|---|---|---|
| Quadrant | BADHDUFLAG | Total packets | Discarded packets |
| A | 0 | 540 | 0 |
| B | 0 | 540 | 0 |
| C | 0 | 540 | 0 |
| D | 0 | 540 | 0 |
| Quadrant | Total seconds | Saturated seconds | Saturation percentage |
|---|---|---|---|
| A | 26675 | 684 | 2.564199% |
| B | 26672 | 923 | 3.460558% |
| C | 26653 | 4201 | 15.761828% |
| D | 26674 | 616 | 2.309365% |
Noise dominated data is calculated using 1-second bins in cleaned event files. If a bin has >2000 counts, and if more than 50% of those come from <1% of pixels, then it is considered to be noise-dominated and hence unusable.
| Quadrant | # 1 sec bins | Bins with >0 counts | Bins with >2000 counts | High rate bins dominated by noise | Noise dominated (total time) | Noise dominated (detector-on time) | Marked lightcurve |
|---|---|---|---|---|---|---|---|
| A | 27427 | 26678 | 10 | 10 | 0.04% | 0.04% |  |
| B | 27427 | 26675 | 47 | 47 | 0.17% | 0.18% |  |
| C | 27427 | 26650 | 45 | 45 | 0.16% | 0.17% |  |
| D | 27427 | 26671 | 10 | 10 | 0.04% | 0.04% |  |
Top three noisy pixels from each quadrant. If the there are fewer than three noisy pixels in the level2.evt file, extra rows are filled as -1
| Pixel properties | Quadrant properties | ||||||
|---|---|---|---|---|---|---|---|
| Quadrant | DetID | PixID | Counts | Sigma | Mean | Median | Sigma |
| A | 0 | 118 | 316462 | 1140.08 | 1227 | 1199 | 276.5 |
| A | 8 | 15 | 238814 | 859.28 | 1227 | 1199 | 276.5 |
| A | 0 | 50 | 225440 | 810.92 | 1227 | 1199 | 276.5 |
| B | 7 | 221 | 877773 | 3623.79 | 1230 | 1194 | 241.9 |
| B | 15 | 204 | 858899 | 3545.76 | 1230 | 1194 | 241.9 |
| B | 10 | 16 | 789878 | 3260.43 | 1230 | 1194 | 241.9 |
| C | 2 | 53 | 6200523 | 24620.99 | 1110 | 1090 | 251.8 |
| C | 12 | 4 | 67865 | 265.2 | 1110 | 1090 | 251.8 |
| C | 7 | 222 | 36381 | 140.16 | 1110 | 1090 | 251.8 |
| D | 12 | 233 | 395100 | 1384.01 | 1213 | 1166 | 284.6 |
| D | 10 | 246 | 296435 | 1037.37 | 1213 | 1166 | 284.6 |
| D | 13 | 248 | 184277 | 643.33 | 1213 | 1166 | 284.6 |
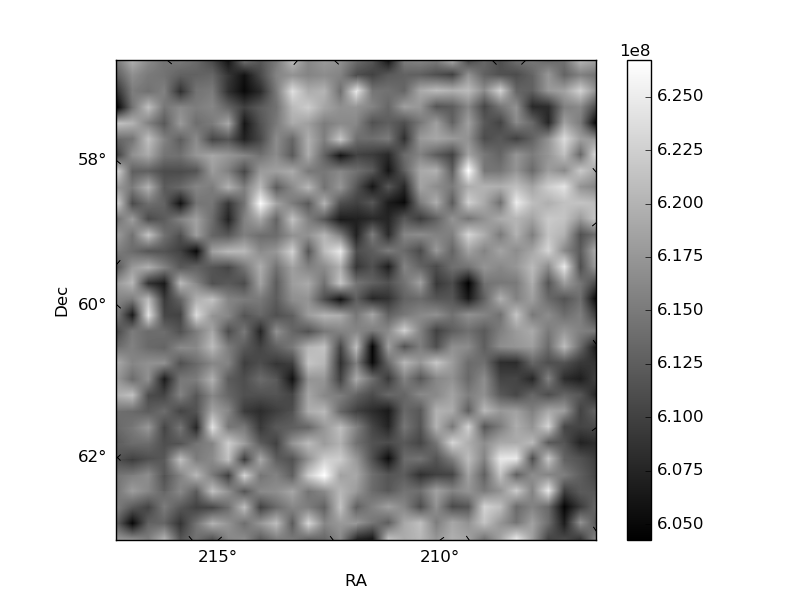
Histogram calculated using DETX and DETY for each event in the final _common_clean file
| Quadrant A | 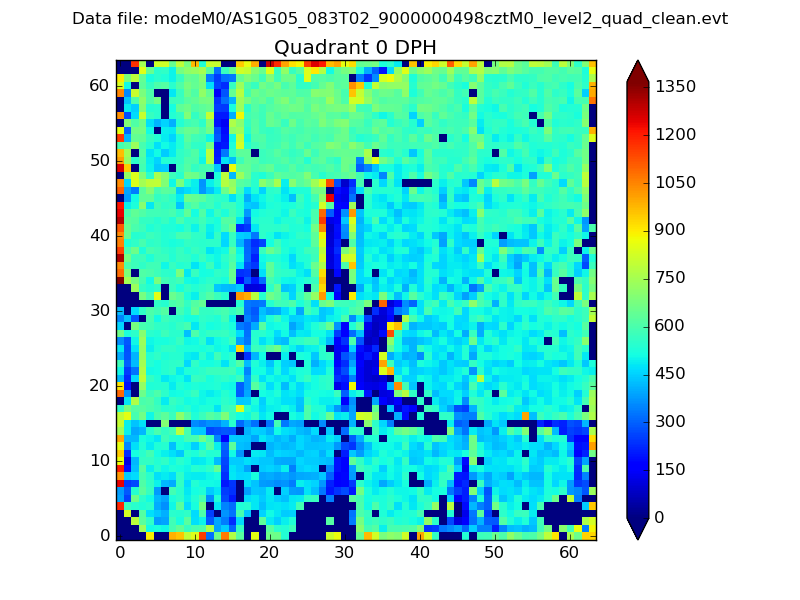 |
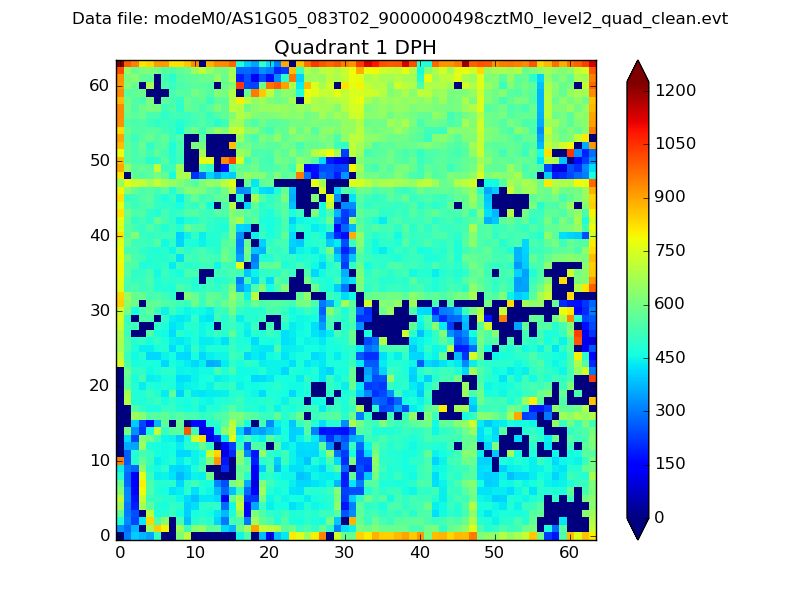 |
Quadrant B |
|---|---|---|---|
| Quadrant D |  |
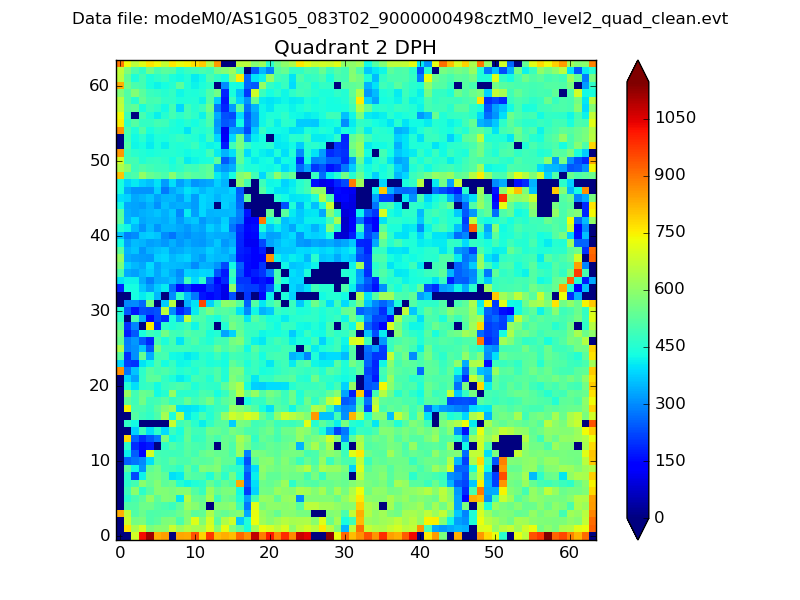 |
Quadrant C |
| Plot type | Count rate plots | Images |
|---|---|---|
| Comparison with Poisson distribution Blue bars denote a histogram of data divided into 1 sec bins. Red curve is a Poisson curve with rate = median count rate of data. |
 |
 |
| Quadrant-wise count rates Data is divided into 100 sec bins |
 |
|
| Module-wise count rates for Quadrant A Data is divided into 100 sec bins |
 |
 |
| Module-wise count rates for Quadrant B Data is divided into 100 sec bins |
 |
 |
| Module-wise count rates for Quadrant C Data is divided into 100 sec bins |
 |
 |
| Module-wise count rates for Quadrant D Data is divided into 100 sec bins |
 |
 |
| Parameter | Plot |
|---|---|
| CZT HV Monitor |  |
| D_VDD |  |
| Temperature 1 |  |
| Veto HV Monitor | 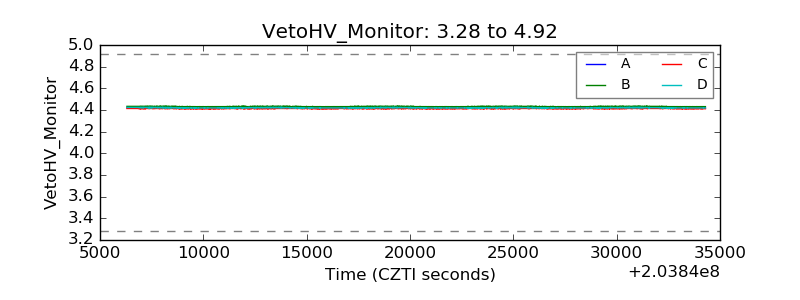 |
| Veto LLD |  |
| Alpha Counter |  |
| _CPM_Rate | 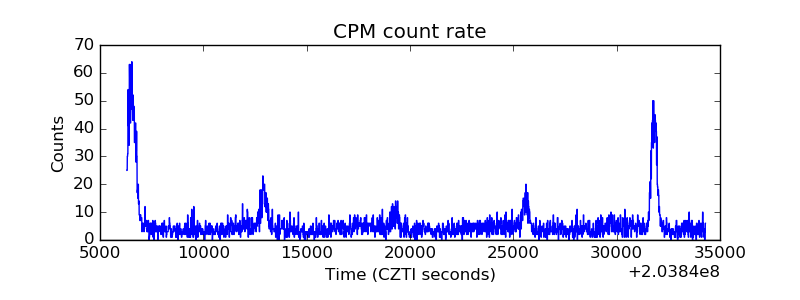 |
| CZT Counter |  |
| +2.5 Volts monitor |  |
| +5 Volts monitor |  |
| _ROLL_ROT |  |
| _Roll_DEC |  |
| _Roll_RA | 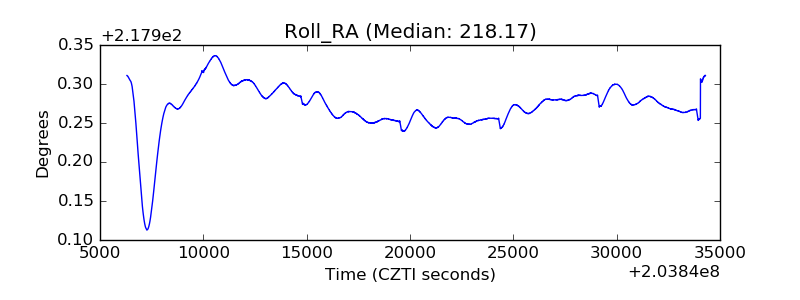 |
| Veto Counter | 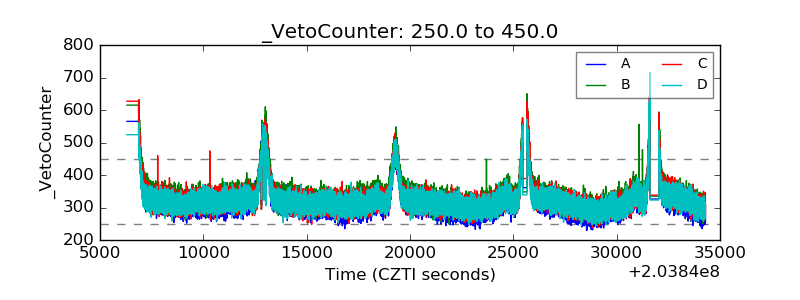 |