| Param | Original file | Final file |
|---|---|---|
| Filename | modeM0/AS1G05_239T02_9000000496cztM0_level2_bc.evt | modeM0/AS1G05_239T02_9000000496cztM0_level2_quad_clean.evt |
| Size (bytes) | 2,584,284,480 | 527,880,960 |
| Size | 2.4 GB | 503.4 MB |
| Events in quadrant A | 16,598,858 | 3,136,038 |
| Events in quadrant B | 13,842,000 | 3,202,288 |
| Events in quadrant C | 29,427,611 | 2,938,753 |
| Events in quadrant D | 14,727,238 | 3,008,991 |
| Mode SS | |||
|---|---|---|---|
| Quadrant | BADHDUFLAG | Total packets | Discarded packets |
| A | 0 | 1096 | 0 |
| B | 0 | 1096 | 0 |
| C | 0 | 1096 | 0 |
| D | 0 | 1096 | 0 |
| Mode M9 | |||
|---|---|---|---|
| Quadrant | BADHDUFLAG | Total packets | Discarded packets |
| A | 0 | 100 | 0 |
| B | 0 | 100 | 0 |
| C | 0 | 100 | 0 |
| D | 0 | 100 | 0 |
| Mode M0 | |||
|---|---|---|---|
| Quadrant | BADHDUFLAG | Total packets | Discarded packets |
| A | 0 | 133858 | 0 |
| B | 0 | 120668 | 0 |
| C | 0 | 183809 | 0 |
| D | 0 | 125442 | 0 |
| Quadrant | Total seconds | Saturated seconds | Saturation percentage |
|---|---|---|---|
| A | 53929 | 2151 | 3.988578% |
| B | 53929 | 687 | 1.273897% |
| C | 53929 | 5107 | 9.469859% |
| D | 53929 | 1317 | 2.442100% |
Noise dominated data is calculated using 1-second bins in cleaned event files. If a bin has >2000 counts, and if more than 50% of those come from <1% of pixels, then it is considered to be noise-dominated and hence unusable.
| Quadrant | # 1 sec bins | Bins with >0 counts | Bins with >2000 counts | High rate bins dominated by noise | Noise dominated (total time) | Noise dominated (detector-on time) | Marked lightcurve |
|---|---|---|---|---|---|---|---|
| A | 63728 | 53920 | 108 | 108 | 0.17% | 0.20% |  |
| B | 63729 | 53923 | 18 | 18 | 0.03% | 0.03% | 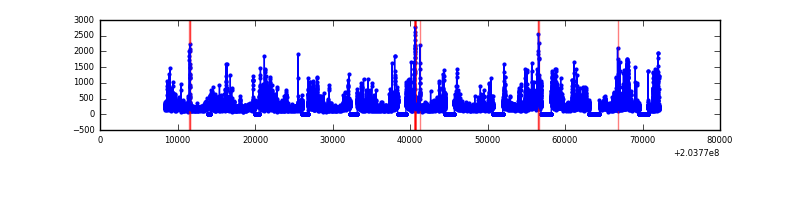 |
| C | 63729 | 53919 | 81 | 81 | 0.13% | 0.15% | 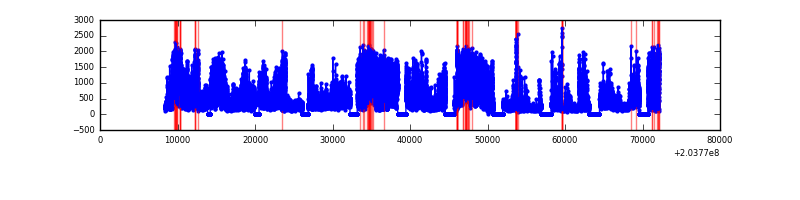 |
| D | 63728 | 53922 | 223 | 223 | 0.35% | 0.41% |  |
Top three noisy pixels from each quadrant. If the there are fewer than three noisy pixels in the level2.evt file, extra rows are filled as -1
| Pixel properties | Quadrant properties | ||||||
|---|---|---|---|---|---|---|---|
| Quadrant | DetID | PixID | Counts | Sigma | Mean | Median | Sigma |
| A | 8 | 15 | 1874058 | 3242.72 | 2598 | 2539 | 577.1 |
| A | 0 | 199 | 1249934 | 2161.32 | 2598 | 2539 | 577.1 |
| A | 0 | 118 | 1176469 | 2034.03 | 2598 | 2539 | 577.1 |
| B | 15 | 204 | 2010635 | 3941.69 | 2665 | 2586 | 509.4 |
| B | 7 | 221 | 654468 | 1279.61 | 2665 | 2586 | 509.4 |
| B | 4 | 170 | 206347 | 399.97 | 2665 | 2586 | 509.4 |
| C | 2 | 53 | 19405566 | 35466.18 | 2450 | 2409 | 547.1 |
| C | 12 | 4 | 104875 | 187.29 | 2450 | 2409 | 547.1 |
| C | 7 | 222 | 103672 | 185.09 | 2450 | 2409 | 547.1 |
| D | 9 | 82 | 1002720 | 1652.92 | 2569 | 2467 | 605.1 |
| D | 1 | 20 | 745293 | 1227.52 | 2569 | 2467 | 605.1 |
| D | 13 | 25 | 557661 | 917.46 | 2569 | 2467 | 605.1 |
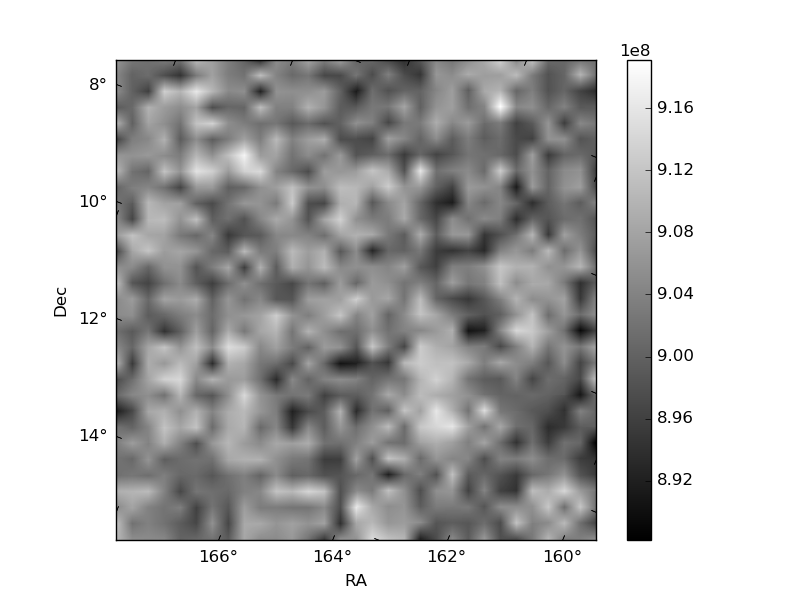
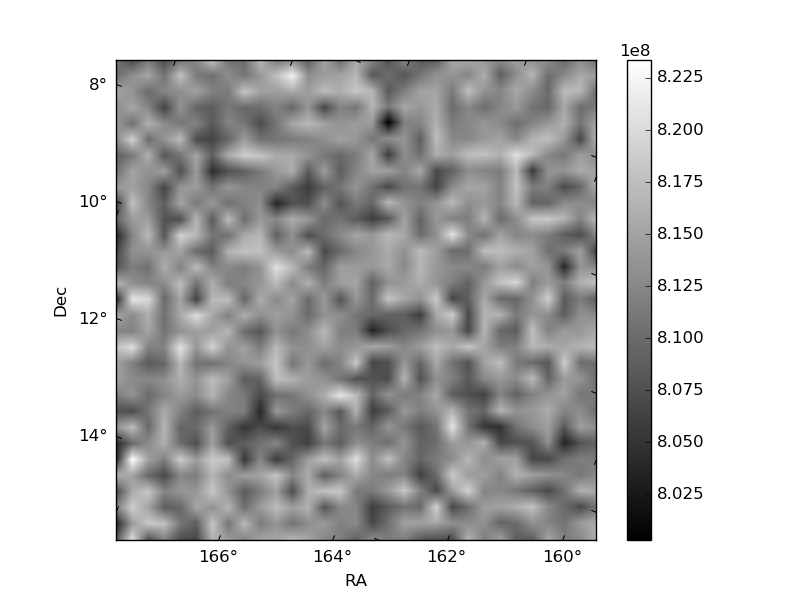
Histogram calculated using DETX and DETY for each event in the final _common_clean file
| Quadrant A | 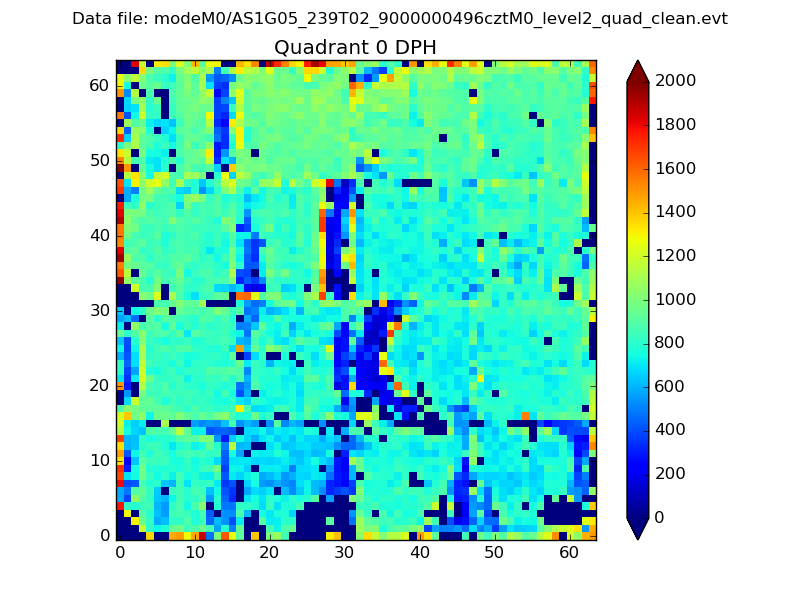 |
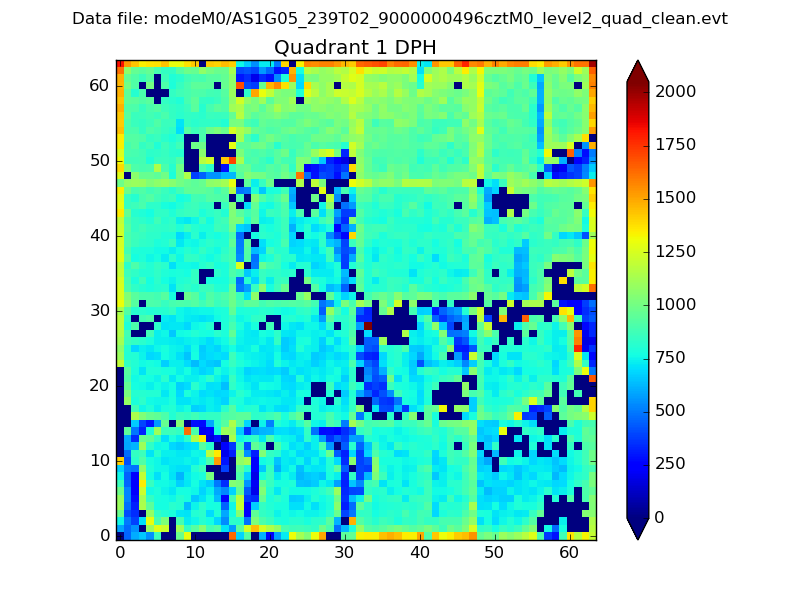 |
Quadrant B |
|---|---|---|---|
| Quadrant D |  |
 |
Quadrant C |
| Plot type | Count rate plots | Images |
|---|---|---|
| Comparison with Poisson distribution Blue bars denote a histogram of data divided into 1 sec bins. Red curve is a Poisson curve with rate = median count rate of data. |
 |
 |
| Quadrant-wise count rates Data is divided into 100 sec bins |
 |
|
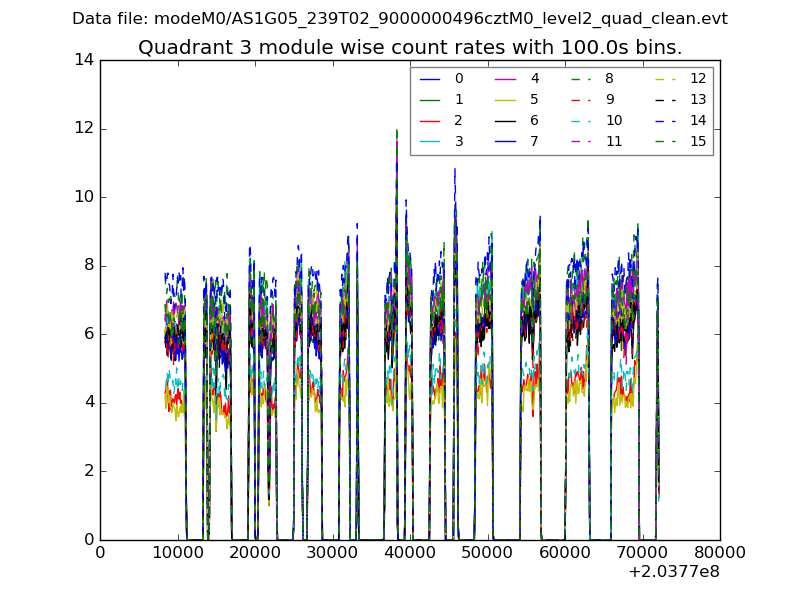
| Module-wise count rates for Quadrant A Data is divided into 100 sec bins |
 |
 |
| Module-wise count rates for Quadrant B Data is divided into 100 sec bins |
 |
 |
| Module-wise count rates for Quadrant C Data is divided into 100 sec bins |
 |
 |
| Module-wise count rates for Quadrant D Data is divided into 100 sec bins |
 |
 |
| Parameter | Plot |
|---|---|
| CZT HV Monitor |  |
| D_VDD |  |
| Temperature 1 |  |
| Veto HV Monitor | 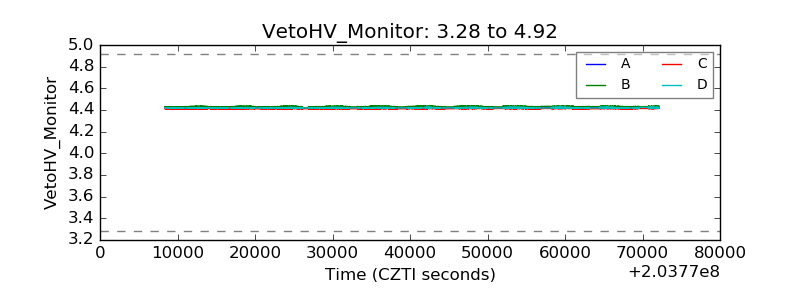 |
| Veto LLD |  |
| Alpha Counter |  |
| _CPM_Rate |  |
| CZT Counter |  |
| +2.5 Volts monitor |  |
| +5 Volts monitor |  |
| _ROLL_ROT | 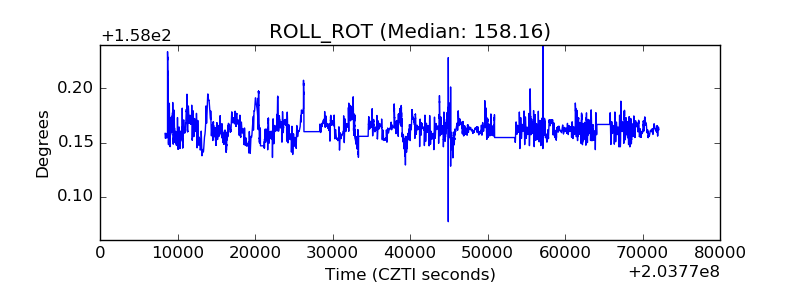 |
| _Roll_DEC |  |
| _Roll_RA |  |
| Veto Counter |  |