| Param | Original file | Final file |
|---|---|---|
| Filename | modeM0/AS1G05_194T01_9000000490cztM0_level2.evt | modeM0/AS1G05_194T01_9000000490cztM0_level2_quad_clean.evt |
| Size (bytes) | 3,357,584,640 | 533,295,360 |
| Size | 3.1 GB | 508.6 MB |
| Events in quadrant A | 26,866,555 | 3,318,898 |
| Events in quadrant B | 23,909,762 | 3,349,361 |
| Events in quadrant C | 24,790,474 | 3,242,802 |
| Events in quadrant D | 23,069,353 | 3,137,312 |
| Mode M0 | |||
|---|---|---|---|
| Quadrant | BADHDUFLAG | Total packets | Discarded packets |
| A | 0 | 109273 | 0 |
| B | 0 | 99995 | 0 |
| C | 0 | 105183 | 0 |
| D | 0 | 101047 | 0 |
| Mode SS | |||
|---|---|---|---|
| Quadrant | BADHDUFLAG | Total packets | Discarded packets |
| A | 0 | 924 | 0 |
| B | 0 | 924 | 0 |
| C | 0 | 924 | 0 |
| D | 0 | 924 | 0 |
| Mode M9 | |||
|---|---|---|---|
| Quadrant | BADHDUFLAG | Total packets | Discarded packets |
| A | 0 | 79 | 0 |
| B | 0 | 79 | 0 |
| C | 0 | 79 | 0 |
| D | 0 | 80 | 0 |
| Quadrant | Total seconds | Saturated seconds | Saturation percentage |
|---|---|---|---|
| A | 45209 | 953 | 2.107987% |
| B | 45208 | 553 | 1.223235% |
| C | 45209 | 758 | 1.676657% |
| D | 45209 | 898 | 1.986330% |
Noise dominated data is calculated using 1-second bins in cleaned event files. If a bin has >2000 counts, and if more than 50% of those come from <1% of pixels, then it is considered to be noise-dominated and hence unusable.
| Quadrant | # 1 sec bins | Bins with >0 counts | Bins with >2000 counts | High rate bins dominated by noise | Noise dominated (total time) | Noise dominated (detector-on time) | Marked lightcurve |
|---|---|---|---|---|---|---|---|
| A | 64149 | 45214 | 377 | 377 | 0.59% | 0.83% |  |
| B | 64149 | 45212 | 31 | 31 | 0.05% | 0.07% |  |
| C | 64149 | 45215 | 405 | 405 | 0.63% | 0.90% |  |
| D | 64149 | 45214 | 581 | 581 | 0.91% | 1.29% | 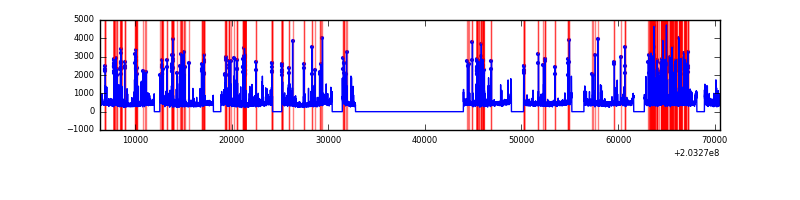 |
Top three noisy pixels from each quadrant. If the there are fewer than three noisy pixels in the level2.evt file, extra rows are filled as -1
| Pixel properties | Quadrant properties | ||||||
|---|---|---|---|---|---|---|---|
| Quadrant | DetID | PixID | Counts | Sigma | Mean | Median | Sigma |
| A | 13 | 251 | 4566703 | 4202.04 | 5372 | 5269 | 1085.5 |
| A | 0 | 50 | 810632 | 741.91 | 5372 | 5269 | 1085.5 |
| A | 0 | 118 | 563142 | 513.92 | 5372 | 5269 | 1085.5 |
| B | 15 | 204 | 1427880 | 1371.5 | 5438 | 5317 | 1037.2 |
| B | 14 | 167 | 798039 | 764.27 | 5438 | 5317 | 1037.2 |
| B | 0 | 173 | 319337 | 302.75 | 5438 | 5317 | 1037.2 |
| C | 2 | 53 | 4286414 | 3577.68 | 5159 | 5187 | 1196.6 |
| C | 9 | 247 | 160830 | 130.07 | 5159 | 5187 | 1196.6 |
| C | 10 | 65 | 80044 | 62.56 | 5159 | 5187 | 1196.6 |
| D | 2 | 32 | 1570561 | 1254.51 | 5159 | 5008 | 1247.9 |
| D | 13 | 223 | 493622 | 391.53 | 5159 | 5008 | 1247.9 |
| D | 13 | 239 | 485869 | 385.32 | 5159 | 5008 | 1247.9 |
Histogram calculated using DETX and DETY for each event in the final _common_clean file
| Quadrant A |  |
 |
Quadrant B |
|---|---|---|---|
| Quadrant D |  |
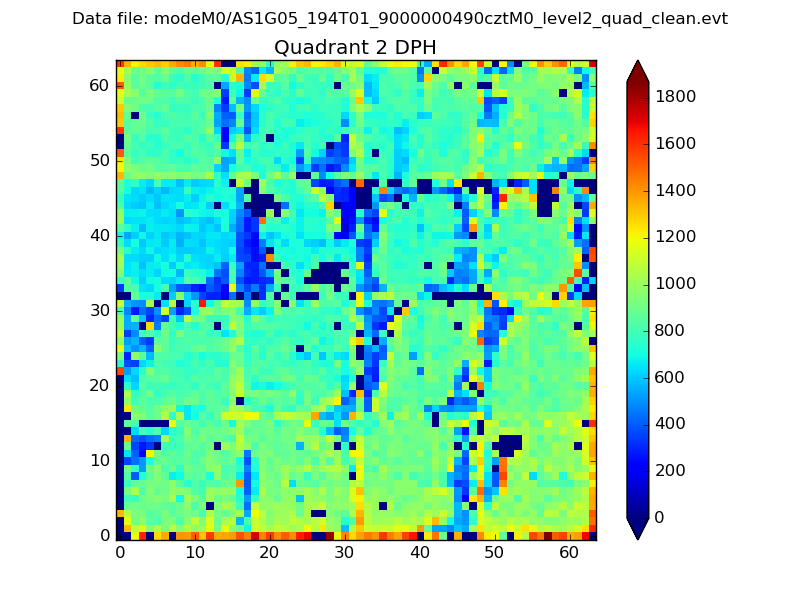 |
Quadrant C |
| Plot type | Count rate plots | Images |
|---|---|---|
| Comparison with Poisson distribution Blue bars denote a histogram of data divided into 1 sec bins. Red curve is a Poisson curve with rate = median count rate of data. |
 |
 |
| Quadrant-wise count rates Data is divided into 100 sec bins |
 |
|
| Module-wise count rates for Quadrant A Data is divided into 100 sec bins |
 |
 |
| Module-wise count rates for Quadrant B Data is divided into 100 sec bins |
 |
 |
| Module-wise count rates for Quadrant C Data is divided into 100 sec bins |
 |
 |
| Module-wise count rates for Quadrant D Data is divided into 100 sec bins |
 |
 |
| Parameter | Plot |
|---|---|
| CZT HV Monitor | 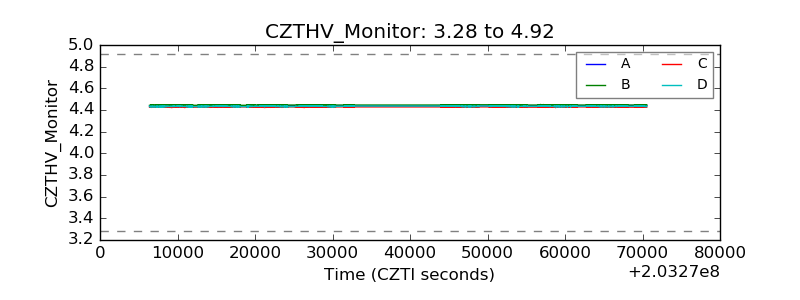 |
| D_VDD |  |
| Temperature 1 | 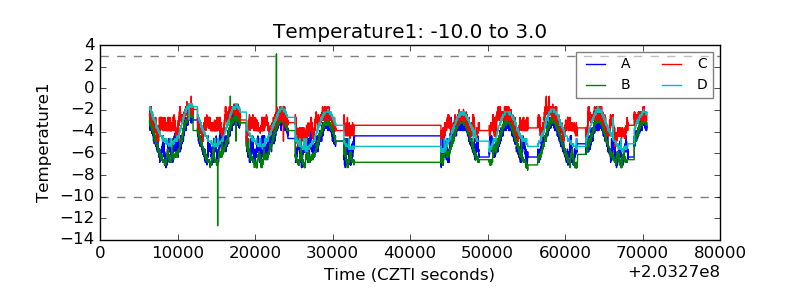 |
| Veto HV Monitor |  |
| Veto LLD |  |
| Alpha Counter |  |
| _CPM_Rate |  |
| CZT Counter |  |
| +2.5 Volts monitor |  |
| +5 Volts monitor |  |
| _ROLL_ROT | 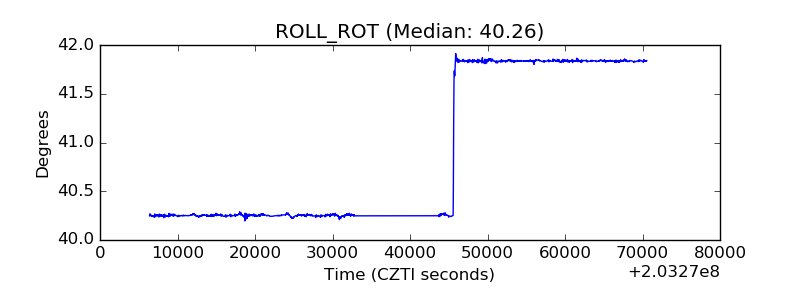 |
| _Roll_DEC |  |
| _Roll_RA | 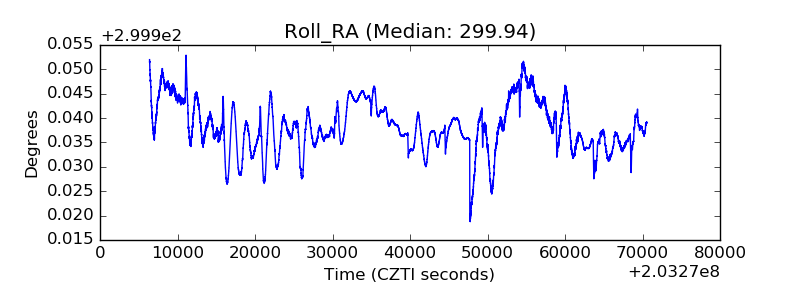 |
| Veto Counter |  |