| Param | Original file | Final file |
|---|---|---|
| Filename | modeM0/AS1G05_152T03_9000000488cztM0_level2_bc.evt | modeM0/AS1G05_152T03_9000000488cztM0_level2_quad_clean.evt |
| Size (bytes) | 2,419,312,320 | 669,375,360 |
| Size | 2.3 GB | 638.4 MB |
| Events in quadrant A | 18,478,259 | 4,163,474 |
| Events in quadrant B | 18,252,822 | 4,178,876 |
| Events in quadrant C | 14,517,556 | 4,133,694 |
| Events in quadrant D | 18,202,147 | 3,950,692 |
| Mode SS | |||
|---|---|---|---|
| Quadrant | BADHDUFLAG | Total packets | Discarded packets |
| A | 0 | 1146 | 0 |
| B | 0 | 1146 | 0 |
| C | 0 | 1146 | 0 |
| D | 0 | 1146 | 0 |
| Mode M9 | |||
|---|---|---|---|
| Quadrant | BADHDUFLAG | Total packets | Discarded packets |
| A | 0 | 97 | 0 |
| B | 0 | 97 | 0 |
| C | 0 | 97 | 0 |
| D | 0 | 97 | 0 |
| Mode M0 | |||
|---|---|---|---|
| Quadrant | BADHDUFLAG | Total packets | Discarded packets |
| A | 0 | 142940 | 0 |
| B | 0 | 140261 | 0 |
| C | 0 | 128381 | 0 |
| D | 0 | 141856 | 0 |
| Quadrant | Total seconds | Saturated seconds | Saturation percentage |
|---|---|---|---|
| A | 56055 | 2308 | 4.117385% |
| B | 56055 | 1956 | 3.489430% |
| C | 56056 | 1438 | 2.565292% |
| D | 56057 | 2831 | 5.050217% |
Noise dominated data is calculated using 1-second bins in cleaned event files. If a bin has >2000 counts, and if more than 50% of those come from <1% of pixels, then it is considered to be noise-dominated and hence unusable.
| Quadrant | # 1 sec bins | Bins with >0 counts | Bins with >2000 counts | High rate bins dominated by noise | Noise dominated (total time) | Noise dominated (detector-on time) | Marked lightcurve |
|---|---|---|---|---|---|---|---|
| A | 65812 | 56052 | 82 | 82 | 0.12% | 0.15% |  |
| B | 65812 | 56053 | 215 | 215 | 0.33% | 0.38% |  |
| C | 65812 | 56055 | 86 | 86 | 0.13% | 0.15% |  |
| D | 65812 | 56054 | 313 | 313 | 0.48% | 0.56% | 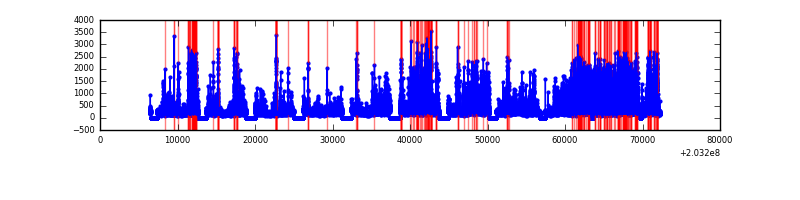 |
Top three noisy pixels from each quadrant. If the there are fewer than three noisy pixels in the level2.evt file, extra rows are filled as -1
| Pixel properties | Quadrant properties | ||||||
|---|---|---|---|---|---|---|---|
| Quadrant | DetID | PixID | Counts | Sigma | Mean | Median | Sigma |
| A | 13 | 251 | 4807659 | 7978.75 | 2725 | 2664 | 602.2 |
| A | 0 | 118 | 1313637 | 2176.89 | 2725 | 2664 | 602.2 |
| A | 0 | 50 | 797849 | 1320.41 | 2725 | 2664 | 602.2 |
| B | 15 | 204 | 2949253 | 5519.54 | 2767 | 2685 | 533.8 |
| B | 0 | 173 | 1574455 | 2944.25 | 2767 | 2685 | 533.8 |
| B | 14 | 167 | 1545434 | 2889.89 | 2767 | 2685 | 533.8 |
| C | 2 | 53 | 3313047 | 5535.42 | 2683 | 2638 | 598.0 |
| C | 1 | 16 | 308821 | 511.98 | 2683 | 2638 | 598.0 |
| C | 14 | 234 | 103722 | 169.03 | 2683 | 2638 | 598.0 |
| D | 2 | 63 | 3602234 | 5696.64 | 2677 | 2574 | 631.9 |
| D | 8 | 112 | 1966895 | 3108.63 | 2677 | 2574 | 631.9 |
| D | 1 | 84 | 805088 | 1270.02 | 2677 | 2574 | 631.9 |
Histogram calculated using DETX and DETY for each event in the final _common_clean file
| Quadrant A |  |
 |
Quadrant B |
|---|---|---|---|
| Quadrant D | 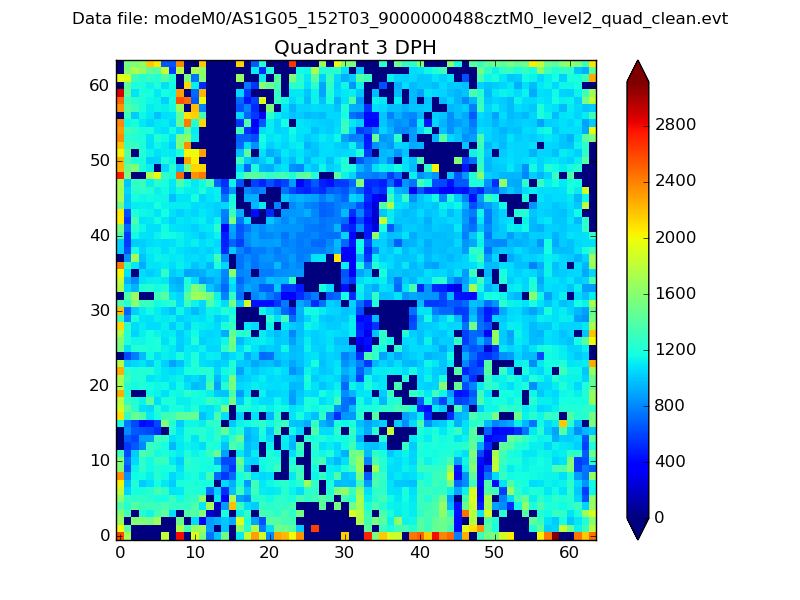 |
 |
Quadrant C |
| Plot type | Count rate plots | Images |
|---|---|---|
| Comparison with Poisson distribution Blue bars denote a histogram of data divided into 1 sec bins. Red curve is a Poisson curve with rate = median count rate of data. |
 |
 |
| Quadrant-wise count rates Data is divided into 100 sec bins |
 |
|
| Module-wise count rates for Quadrant A Data is divided into 100 sec bins |
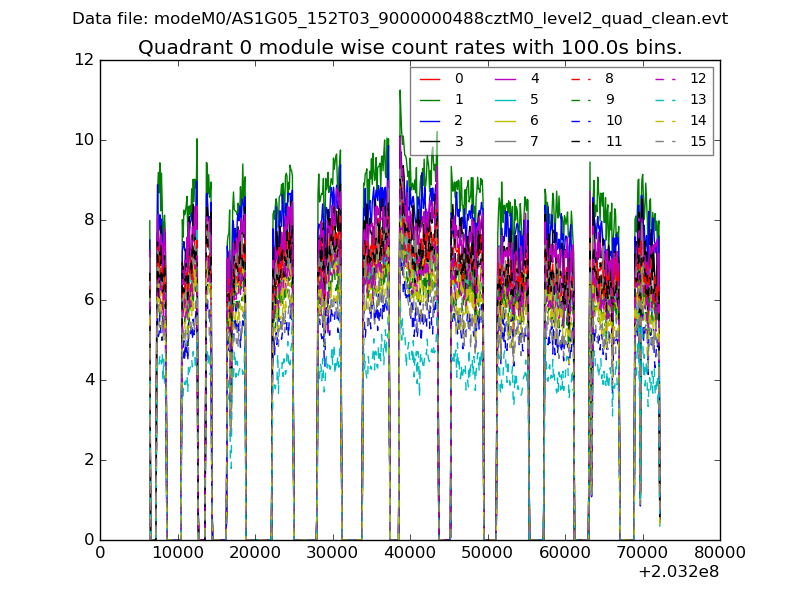 |
 |
| Module-wise count rates for Quadrant B Data is divided into 100 sec bins |
 |
 |
| Module-wise count rates for Quadrant C Data is divided into 100 sec bins |
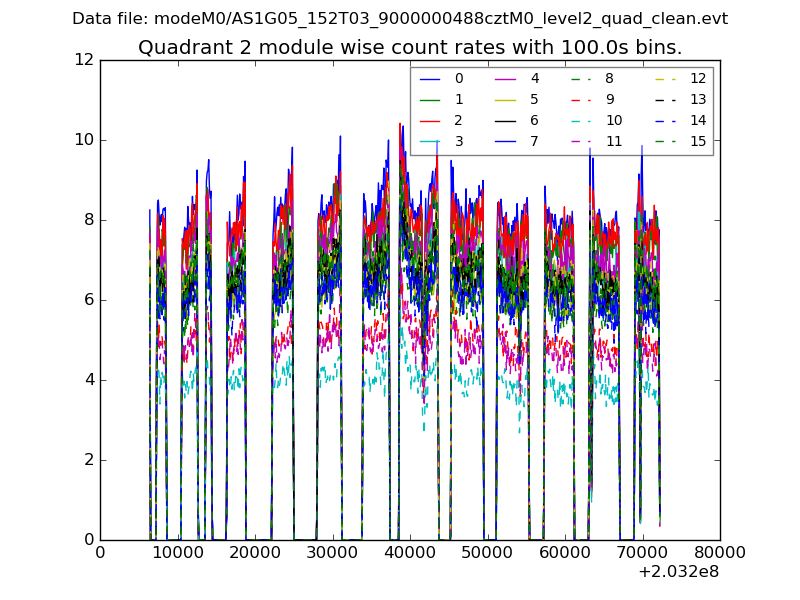 |
 |
| Module-wise count rates for Quadrant D Data is divided into 100 sec bins |
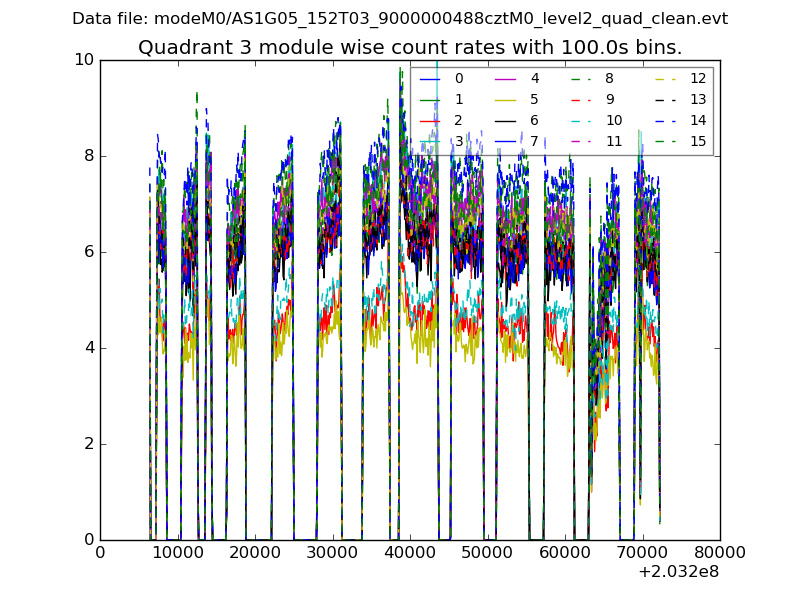 |
 |
| Parameter | Plot |
|---|---|
| CZT HV Monitor |  |
| D_VDD | 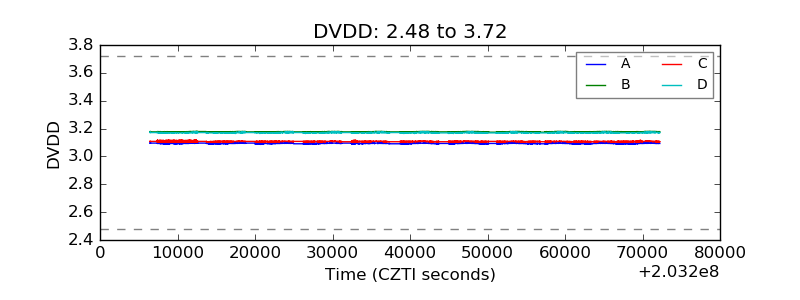 |
| Temperature 1 |  |
| Veto HV Monitor |  |
| Veto LLD |  |
| Alpha Counter |  |
| _CPM_Rate |  |
| CZT Counter |  |
| +2.5 Volts monitor | 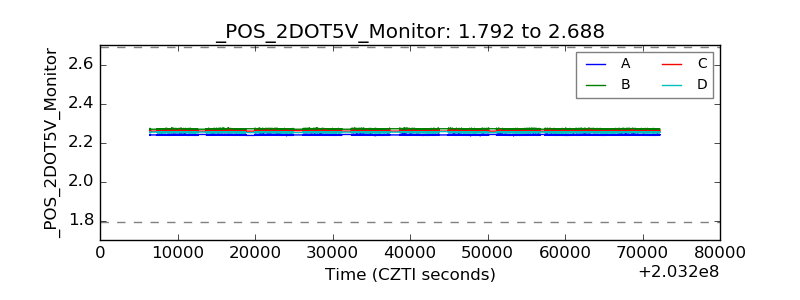 |
| +5 Volts monitor |  |
| _ROLL_ROT |  |
| _Roll_DEC |  |
| _Roll_RA |  |
| Veto Counter | 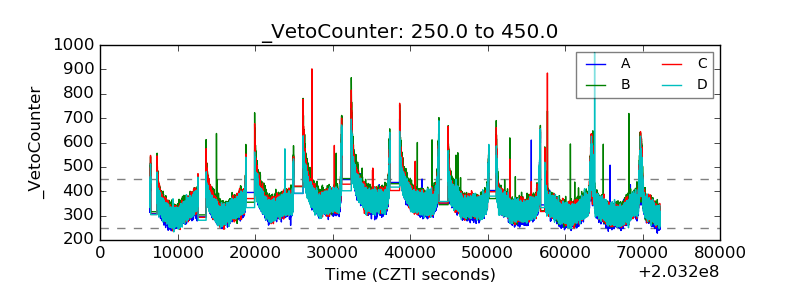 |