| Param | Original file | Final file |
|---|---|---|
| Filename | modeM0/AS1G05_248T01_9000000486cztM0_level2_bc.evt | modeM0/AS1G05_248T01_9000000486cztM0_level2_quad_clean.evt |
| Size (bytes) | 13,052,995,200 | 3,677,276,160 |
| Size | 12.2 GB | 3.4 GB |
| Events in quadrant A | 93,876,343 | 22,660,752 |
| Events in quadrant B | 105,658,045 | 22,402,815 |
| Events in quadrant C | 64,975,035 | 22,505,896 |
| Events in quadrant D | 108,695,315 | 21,547,297 |
| Mode SS | |||
|---|---|---|---|
| Quadrant | BADHDUFLAG | Total packets | Discarded packets |
| A | 0 | 6614 | 0 |
| B | 0 | 6614 | 0 |
| C | 0 | 6614 | 0 |
| D | 0 | 6614 | 0 |
| Mode M9 | |||
|---|---|---|---|
| Quadrant | BADHDUFLAG | Total packets | Discarded packets |
| A | 0 | 458 | 0 |
| B | 0 | 458 | 0 |
| C | 0 | 458 | 0 |
| D | 0 | 458 | 0 |
| Mode M0 | |||
|---|---|---|---|
| Quadrant | BADHDUFLAG | Total packets | Discarded packets |
| A | 0 | 784361 | 0 |
| B | 0 | 816571 | 0 |
| C | 0 | 676917 | 0 |
| D | 0 | 820888 | 0 |
| Quadrant | Total seconds | Saturated seconds | Saturation percentage |
|---|---|---|---|
| A | 324988 | 11991 | 3.689675% |
| B | 324988 | 12017 | 3.697675% |
| C | 324987 | 2911 | 0.895728% |
| D | 324988 | 13585 | 4.180154% |
Noise dominated data is calculated using 1-second bins in cleaned event files. If a bin has >2000 counts, and if more than 50% of those come from <1% of pixels, then it is considered to be noise-dominated and hence unusable.
| Quadrant | # 1 sec bins | Bins with >0 counts | Bins with >2000 counts | High rate bins dominated by noise | Noise dominated (total time) | Noise dominated (detector-on time) | Marked lightcurve |
|---|---|---|---|---|---|---|---|
| A | 370840 | 324974 | 1006 | 1006 | 0.27% | 0.31% |  |
| B | 370840 | 324972 | 966 | 966 | 0.26% | 0.30% |  |
| C | 370840 | 324985 | 43 | 43 | 0.01% | 0.01% |  |
| D | 370840 | 324984 | 3192 | 3192 | 0.86% | 0.98% |  |
Top three noisy pixels from each quadrant. If the there are fewer than three noisy pixels in the level2.evt file, extra rows are filled as -1
| Pixel properties | Quadrant properties | ||||||
|---|---|---|---|---|---|---|---|
| Quadrant | DetID | PixID | Counts | Sigma | Mean | Median | Sigma |
| A | 13 | 251 | 13405464 | 3840.13 | 15593 | 15235 | 3486.9 |
| A | 0 | 118 | 10660042 | 3052.78 | 15593 | 15235 | 3486.9 |
| A | 8 | 15 | 3413230 | 974.5 | 15593 | 15235 | 3486.9 |
| B | 0 | 173 | 16277014 | 5406.81 | 15617 | 15157 | 3007.7 |
| B | 15 | 204 | 16087407 | 5343.77 | 15617 | 15157 | 3007.7 |
| B | 14 | 167 | 2457808 | 812.14 | 15617 | 15157 | 3007.7 |
| C | 2 | 53 | 3087012 | 888.59 | 15389 | 15107 | 3457.1 |
| C | 1 | 16 | 342200 | 94.62 | 15389 | 15107 | 3457.1 |
| C | 12 | 4 | 267847 | 73.11 | 15389 | 15107 | 3457.1 |
| D | 1 | 20 | 12166452 | 3278.92 | 15394 | 14746 | 3706.0 |
| D | 12 | 79 | 8245566 | 2220.94 | 15394 | 14746 | 3706.0 |
| D | 1 | 84 | 8184211 | 2204.38 | 15394 | 14746 | 3706.0 |
Histogram calculated using DETX and DETY for each event in the final _common_clean file
| Quadrant A |  |
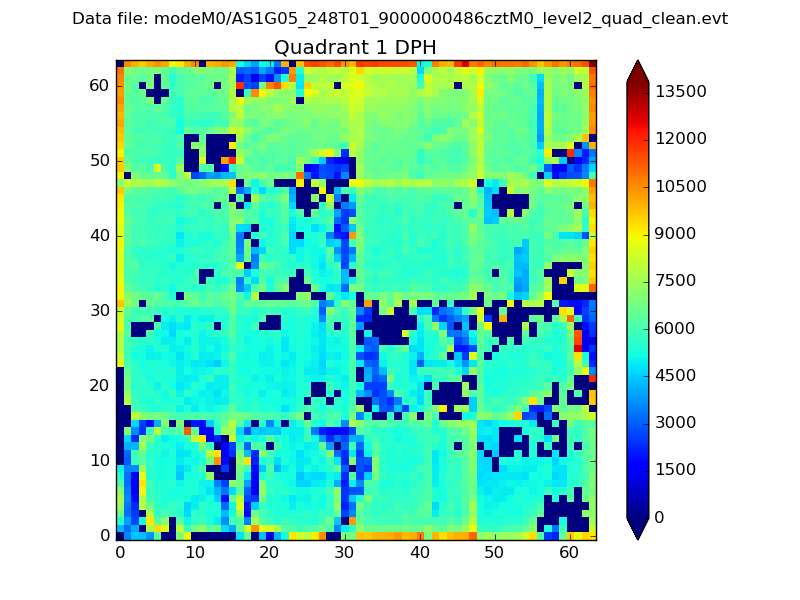 |
Quadrant B |
|---|---|---|---|
| Quadrant D |  |
 |
Quadrant C |
| Plot type | Count rate plots | Images |
|---|---|---|
| Comparison with Poisson distribution Blue bars denote a histogram of data divided into 1 sec bins. Red curve is a Poisson curve with rate = median count rate of data. |
 |
 |
| Quadrant-wise count rates Data is divided into 100 sec bins |
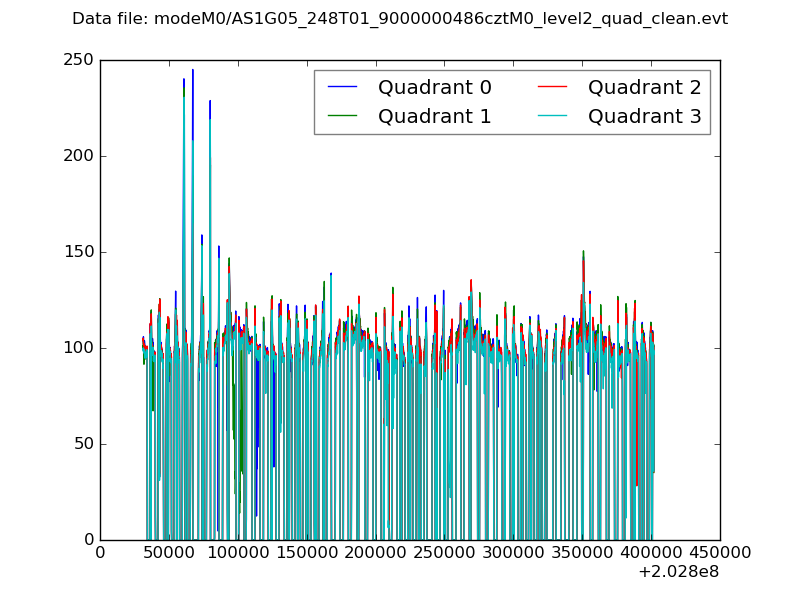 |
|
| Module-wise count rates for Quadrant A Data is divided into 100 sec bins |
 |
 |
| Module-wise count rates for Quadrant B Data is divided into 100 sec bins |
 |
 |
| Module-wise count rates for Quadrant C Data is divided into 100 sec bins |
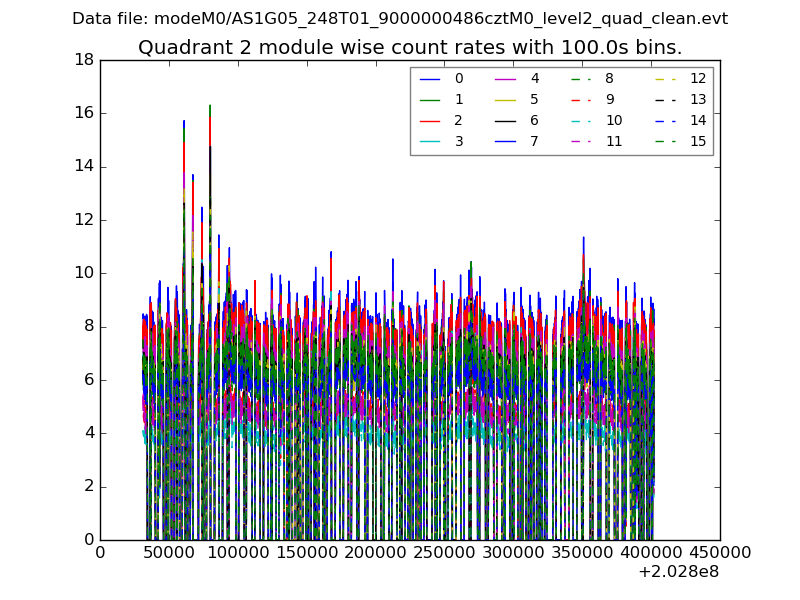 |
 |
| Module-wise count rates for Quadrant D Data is divided into 100 sec bins |
 |
 |
| Parameter | Plot |
|---|---|
| CZT HV Monitor |  |
| D_VDD |  |
| Temperature 1 |  |
| Veto HV Monitor |  |
| Veto LLD |  |
| Alpha Counter |  |
| _CPM_Rate |  |
| CZT Counter |  |
| +2.5 Volts monitor |  |
| +5 Volts monitor | 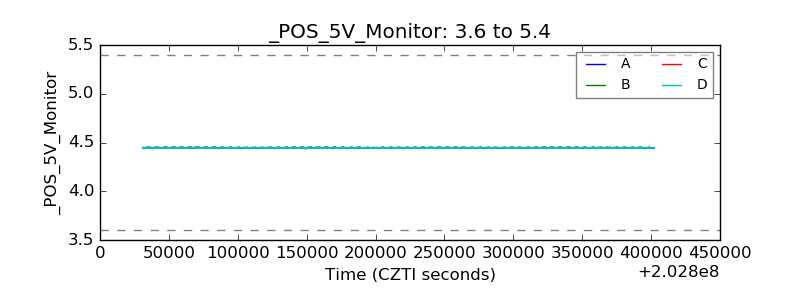 |
| _ROLL_ROT | 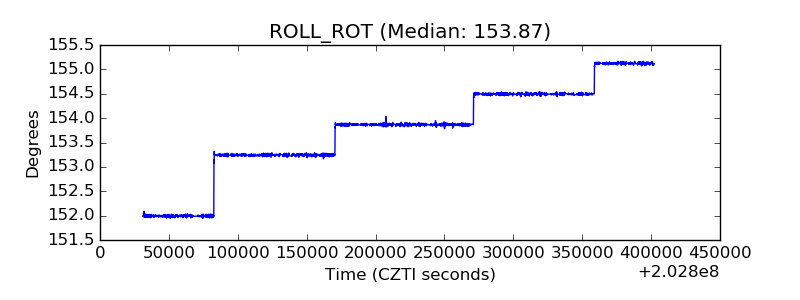 |
| _Roll_DEC |  |
| _Roll_RA |  |
| Veto Counter |  |