| Param | Original file | Final file |
|---|---|---|
| Filename | modeM0/AS1G05_182T01_9000000484cztM0_level2_bc.evt | modeM0/AS1G05_182T01_9000000484cztM0_level2_quad_clean.evt |
| Size (bytes) | 2,598,171,840 | 557,490,240 |
| Size | 2.4 GB | 531.7 MB |
| Events in quadrant A | 13,759,764 | 3,498,284 |
| Events in quadrant B | 15,526,469 | 3,465,903 |
| Events in quadrant C | 34,568,155 | 3,078,172 |
| Events in quadrant D | 11,399,463 | 3,386,020 |
| Mode M9 | |||
|---|---|---|---|
| Quadrant | BADHDUFLAG | Total packets | Discarded packets |
| A | 0 | 94 | 0 |
| B | 0 | 94 | 0 |
| C | 0 | 94 | 0 |
| D | 0 | 94 | 0 |
| Mode M0 | |||
|---|---|---|---|
| Quadrant | BADHDUFLAG | Total packets | Discarded packets |
| A | 0 | 120137 | 0 |
| B | 0 | 125356 | 0 |
| C | 0 | 202535 | 0 |
| D | 0 | 108777 | 0 |
| Mode SS | |||
|---|---|---|---|
| Quadrant | BADHDUFLAG | Total packets | Discarded packets |
| A | 0 | 1028 | 0 |
| B | 0 | 1028 | 0 |
| C | 0 | 1028 | 0 |
| D | 0 | 1028 | 0 |
| Quadrant | Total seconds | Saturated seconds | Saturation percentage |
|---|---|---|---|
| A | 50294 | 2464 | 4.899193% |
| B | 50294 | 2642 | 5.253112% |
| C | 50294 | 15377 | 30.574224% |
| D | 50294 | 678 | 1.348073% |
Noise dominated data is calculated using 1-second bins in cleaned event files. If a bin has >2000 counts, and if more than 50% of those come from <1% of pixels, then it is considered to be noise-dominated and hence unusable.
| Quadrant | # 1 sec bins | Bins with >0 counts | Bins with >2000 counts | High rate bins dominated by noise | Noise dominated (total time) | Noise dominated (detector-on time) | Marked lightcurve |
|---|---|---|---|---|---|---|---|
| A | 59819 | 50275 | 355 | 355 | 0.59% | 0.71% |  |
| B | 59819 | 50291 | 94 | 94 | 0.16% | 0.19% |  |
| C | 59819 | 50291 | 1446 | 1446 | 2.42% | 2.88% |  |
| D | 59819 | 50292 | 43 | 43 | 0.07% | 0.09% |  |
Top three noisy pixels from each quadrant. If the there are fewer than three noisy pixels in the level2.evt file, extra rows are filled as -1
| Pixel properties | Quadrant properties | ||||||
|---|---|---|---|---|---|---|---|
| Quadrant | DetID | PixID | Counts | Sigma | Mean | Median | Sigma |
| A | 13 | 251 | 2433826 | 4528.64 | 2430 | 2372 | 536.9 |
| A | 0 | 50 | 634707 | 1177.74 | 2430 | 2372 | 536.9 |
| A | 0 | 118 | 528092 | 979.17 | 2430 | 2372 | 536.9 |
| B | 0 | 173 | 2321222 | 4902.69 | 2462 | 2387 | 473.0 |
| B | 15 | 204 | 1853737 | 3914.29 | 2462 | 2387 | 473.0 |
| B | 14 | 167 | 603314 | 1270.53 | 2462 | 2387 | 473.0 |
| C | 2 | 53 | 26021776 | 54102.53 | 2144 | 2101 | 480.9 |
| C | 1 | 16 | 40974 | 80.83 | 2144 | 2101 | 480.9 |
| C | 8 | 128 | 31376 | 60.87 | 2144 | 2101 | 480.9 |
| D | 2 | 37 | 295643 | 519.88 | 2440 | 2346 | 564.2 |
| D | 13 | 239 | 288237 | 506.76 | 2440 | 2346 | 564.2 |
| D | 14 | 34 | 245251 | 430.56 | 2440 | 2346 | 564.2 |
Histogram calculated using DETX and DETY for each event in the final _common_clean file
| Quadrant A |  |
 |
Quadrant B |
|---|---|---|---|
| Quadrant D |  |
 |
Quadrant C |
| Plot type | Count rate plots | Images |
|---|---|---|
| Comparison with Poisson distribution Blue bars denote a histogram of data divided into 1 sec bins. Red curve is a Poisson curve with rate = median count rate of data. |
 |
 |
| Quadrant-wise count rates Data is divided into 100 sec bins |
 |
|
| Module-wise count rates for Quadrant A Data is divided into 100 sec bins |
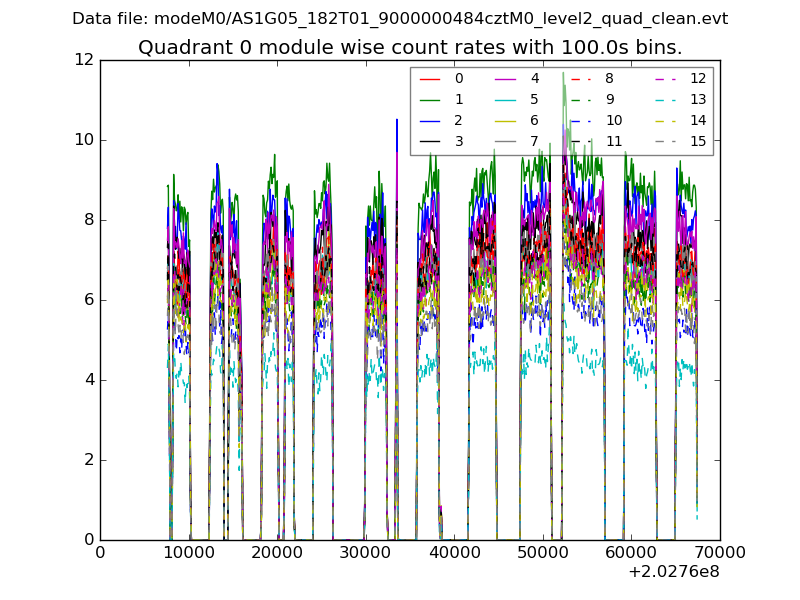 |
 |
| Module-wise count rates for Quadrant B Data is divided into 100 sec bins |
 |
 |
| Module-wise count rates for Quadrant C Data is divided into 100 sec bins |
 |
 |
| Module-wise count rates for Quadrant D Data is divided into 100 sec bins |
 |
 |
| Parameter | Plot |
|---|---|
| CZT HV Monitor |  |
| D_VDD | 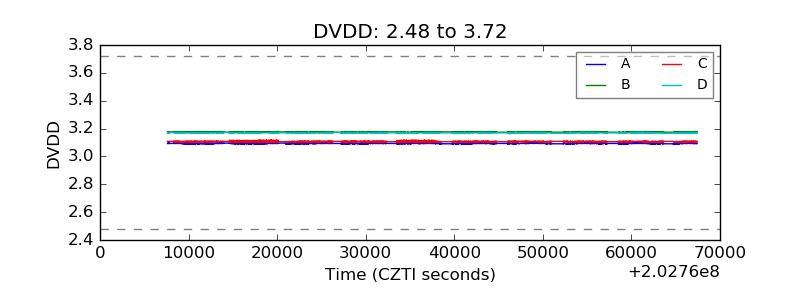 |
| Temperature 1 | 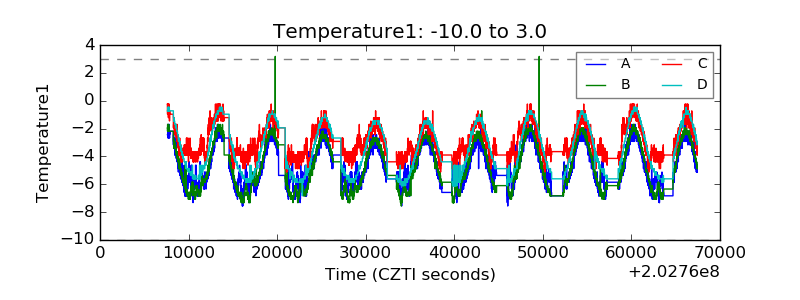 |
| Veto HV Monitor |  |
| Veto LLD |  |
| Alpha Counter |  |
| _CPM_Rate |  |
| CZT Counter |  |
| +2.5 Volts monitor |  |
| +5 Volts monitor |  |
| _ROLL_ROT |  |
| _Roll_DEC | 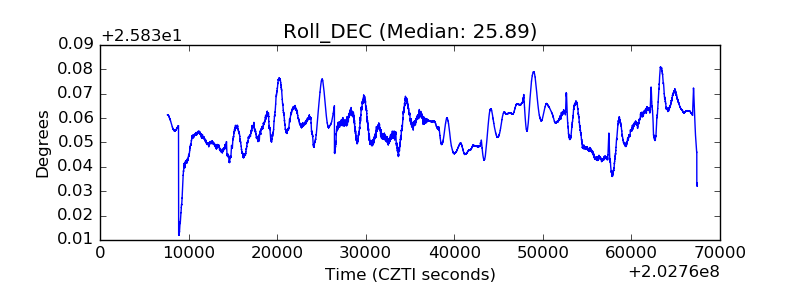 |
| _Roll_RA | 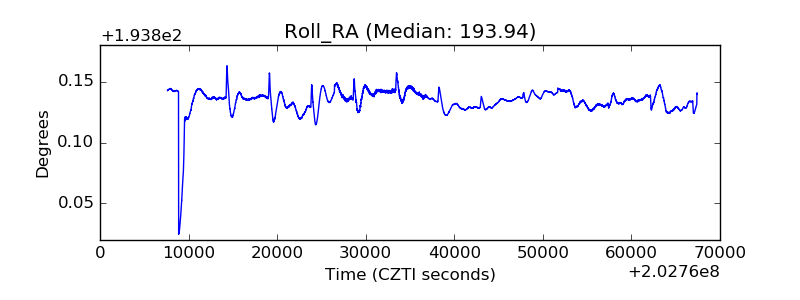 |
| Veto Counter |  |