| Param | Original file | Final file |
|---|---|---|
| Filename | modeM0/AS1G05_009T01_9000000482cztM0_level2_bc.evt | modeM0/AS1G05_009T01_9000000482cztM0_level2_quad_clean.evt |
| Size (bytes) | 3,876,465,600 | 1,029,418,560 |
| Size | 3.6 GB | 981.7 MB |
| Events in quadrant A | 28,991,039 | 6,124,945 |
| Events in quadrant B | 37,349,222 | 6,223,474 |
| Events in quadrant C | 19,537,365 | 6,238,945 |
| Events in quadrant D | 25,031,214 | 6,056,142 |
| Mode SS | |||
|---|---|---|---|
| Quadrant | BADHDUFLAG | Total packets | Discarded packets |
| A | 0 | 1942 | 0 |
| B | 0 | 1942 | 0 |
| C | 0 | 1942 | 0 |
| D | 0 | 1942 | 0 |
| Mode M9 | |||
|---|---|---|---|
| Quadrant | BADHDUFLAG | Total packets | Discarded packets |
| A | 0 | 129 | 0 |
| B | 0 | 129 | 0 |
| C | 0 | 129 | 0 |
| D | 0 | 129 | 0 |
| Mode M0 | |||
|---|---|---|---|
| Quadrant | BADHDUFLAG | Total packets | Discarded packets |
| A | 0 | 238348 | 0 |
| B | 0 | 256562 | 0 |
| C | 0 | 199708 | 0 |
| D | 0 | 221197 | 0 |
| Quadrant | Total seconds | Saturated seconds | Saturation percentage |
|---|---|---|---|
| A | 95319 | 6061 | 6.358648% |
| B | 95319 | 4218 | 4.425141% |
| C | 95319 | 1206 | 1.265225% |
| D | 95318 | 2319 | 2.432909% |
Noise dominated data is calculated using 1-second bins in cleaned event files. If a bin has >2000 counts, and if more than 50% of those come from <1% of pixels, then it is considered to be noise-dominated and hence unusable.
| Quadrant | # 1 sec bins | Bins with >0 counts | Bins with >2000 counts | High rate bins dominated by noise | Noise dominated (total time) | Noise dominated (detector-on time) | Marked lightcurve |
|---|---|---|---|---|---|---|---|
| A | 113326 | 95325 | 1228 | 1228 | 1.08% | 1.29% |  |
| B | 113326 | 95324 | 1131 | 1131 | 1.00% | 1.19% |  |
| C | 113326 | 95319 | 50 | 50 | 0.04% | 0.05% |  |
| D | 113326 | 95319 | 202 | 202 | 0.18% | 0.21% |  |
Top three noisy pixels from each quadrant. If the there are fewer than three noisy pixels in the level2.evt file, extra rows are filled as -1
| Pixel properties | Quadrant properties | ||||||
|---|---|---|---|---|---|---|---|
| Quadrant | DetID | PixID | Counts | Sigma | Mean | Median | Sigma |
| A | 13 | 251 | 9618102 | 9573.99 | 4506 | 4395 | 1004.1 |
| A | 13 | 164 | 696943 | 689.69 | 4506 | 4395 | 1004.1 |
| A | 0 | 50 | 497332 | 490.9 | 4506 | 4395 | 1004.1 |
| B | 14 | 167 | 9091712 | 10095.59 | 4638 | 4491 | 900.1 |
| B | 15 | 204 | 3601411 | 3996.05 | 4638 | 4491 | 900.1 |
| B | 5 | 70 | 3446266 | 3823.69 | 4638 | 4491 | 900.1 |
| C | 2 | 53 | 1081187 | 1058.54 | 4563 | 4471 | 1017.2 |
| C | 9 | 247 | 241513 | 233.04 | 4563 | 4471 | 1017.2 |
| C | 8 | 208 | 82316 | 76.53 | 4563 | 4471 | 1017.2 |
| D | 9 | 35 | 1961945 | 1826.57 | 4575 | 4388 | 1071.7 |
| D | 13 | 223 | 1580820 | 1470.95 | 4575 | 4388 | 1071.7 |
| D | 13 | 239 | 822776 | 763.63 | 4575 | 4388 | 1071.7 |
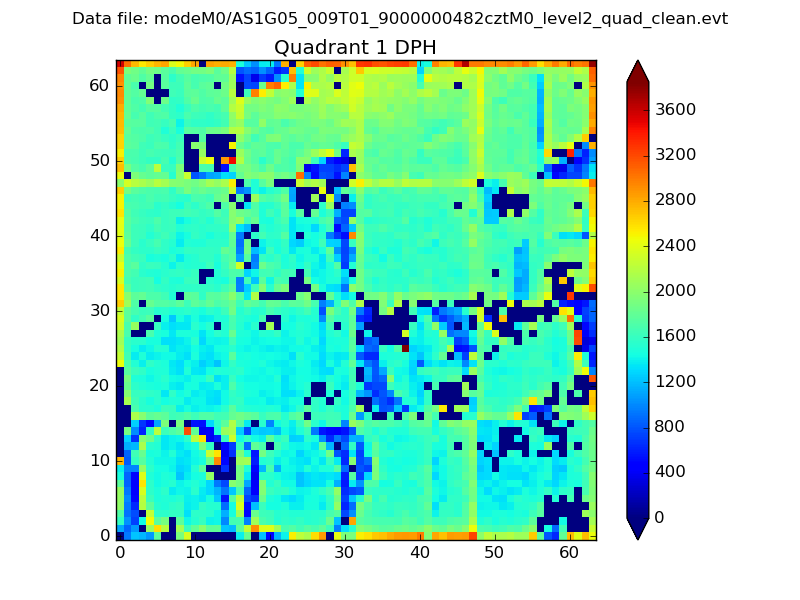
Histogram calculated using DETX and DETY for each event in the final _common_clean file
| Quadrant A |  |
 |
Quadrant B |
|---|---|---|---|
| Quadrant D | 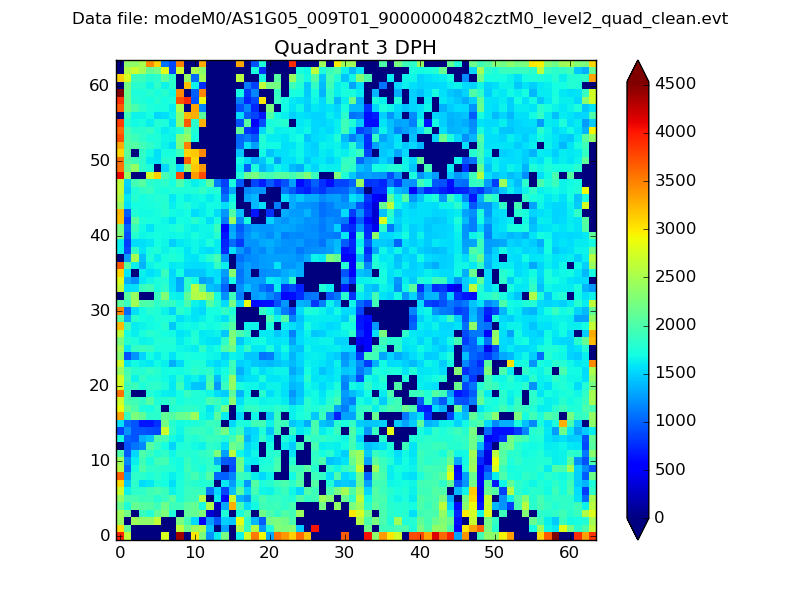 |
 |
Quadrant C |
| Plot type | Count rate plots | Images |
|---|---|---|
| Comparison with Poisson distribution Blue bars denote a histogram of data divided into 1 sec bins. Red curve is a Poisson curve with rate = median count rate of data. |
 |
 |
| Quadrant-wise count rates Data is divided into 100 sec bins |
 |
|
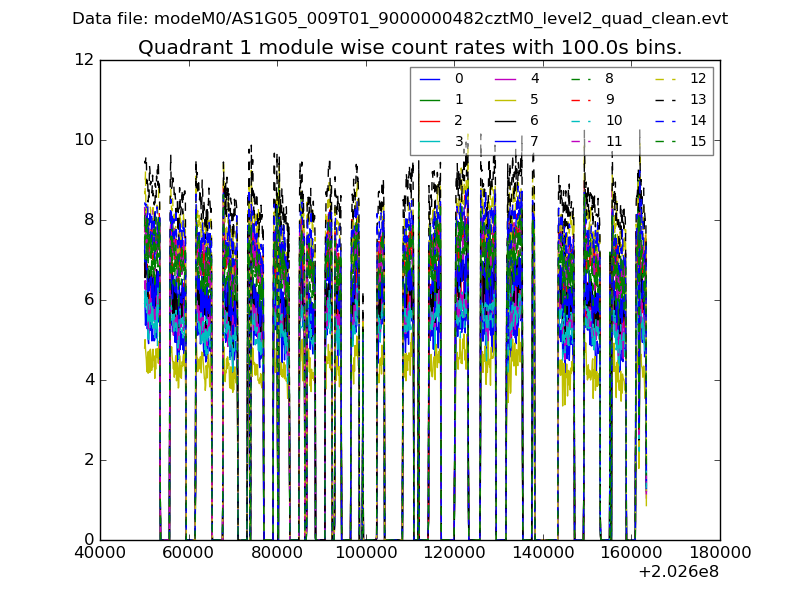
| Module-wise count rates for Quadrant A Data is divided into 100 sec bins |
 |
 |
| Module-wise count rates for Quadrant B Data is divided into 100 sec bins |
 |
 |
| Module-wise count rates for Quadrant C Data is divided into 100 sec bins |
 |
 |
| Module-wise count rates for Quadrant D Data is divided into 100 sec bins |
 |
 |
| Parameter | Plot |
|---|---|
| CZT HV Monitor |  |
| D_VDD |  |
| Temperature 1 |  |
| Veto HV Monitor | 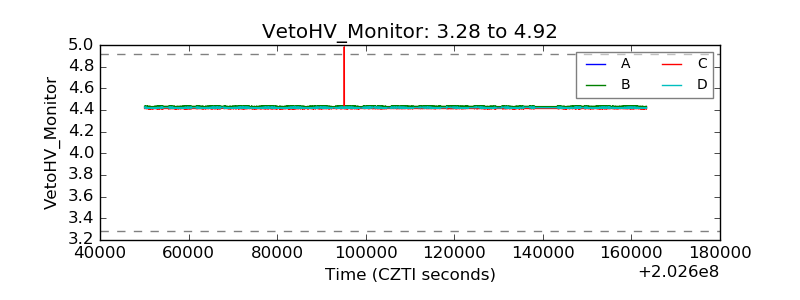 |
| Veto LLD |  |
| Alpha Counter |  |
| _CPM_Rate |  |
| CZT Counter |  |
| +2.5 Volts monitor |  |
| +5 Volts monitor |  |
| _ROLL_ROT |  |
| _Roll_DEC |  |
| _Roll_RA |  |
| Veto Counter | 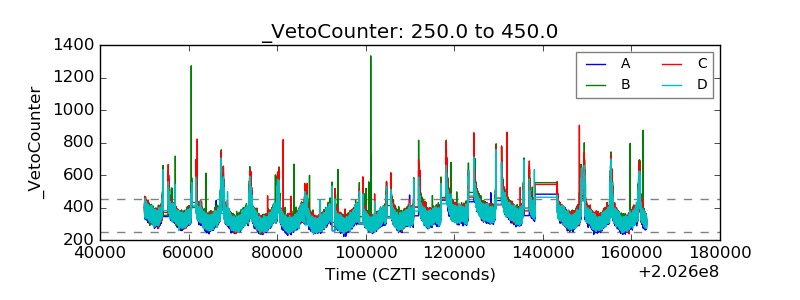 |