| Param | Original file | Final file |
|---|---|---|
| Filename | modeM0/AS1G05_152T04_9000000480cztM0_level2.evt | modeM0/AS1G05_152T04_9000000480cztM0_level2_quad_clean.evt |
| Size (bytes) | 1,925,697,600 | 327,761,280 |
| Size | 1.8 GB | 312.6 MB |
| Events in quadrant A | 15,686,378 | 2,051,724 |
| Events in quadrant B | 15,360,327 | 2,098,883 |
| Events in quadrant C | 13,091,586 | 2,027,623 |
| Events in quadrant D | 12,476,626 | 2,010,301 |
| Mode M9 | |||
|---|---|---|---|
| Quadrant | BADHDUFLAG | Total packets | Discarded packets |
| A | 0 | 48 | 0 |
| B | 0 | 48 | 0 |
| C | 0 | 48 | 0 |
| D | 0 | 49 | 0 |
| Mode SS | |||
|---|---|---|---|
| Quadrant | BADHDUFLAG | Total packets | Discarded packets |
| A | 0 | 512 | 0 |
| B | 0 | 512 | 0 |
| C | 0 | 512 | 0 |
| D | 0 | 512 | 0 |
| Mode M0 | |||
|---|---|---|---|
| Quadrant | BADHDUFLAG | Total packets | Discarded packets |
| A | 0 | 63047 | 0 |
| B | 0 | 63326 | 0 |
| C | 0 | 56411 | 0 |
| D | 0 | 55053 | 0 |
| Quadrant | Total seconds | Saturated seconds | Saturation percentage |
|---|---|---|---|
| A | 25274 | 1165 | 4.609480% |
| B | 25274 | 393 | 1.554958% |
| C | 25274 | 834 | 3.299834% |
| D | 25274 | 345 | 1.365039% |
Noise dominated data is calculated using 1-second bins in cleaned event files. If a bin has >2000 counts, and if more than 50% of those come from <1% of pixels, then it is considered to be noise-dominated and hence unusable.
| Quadrant | # 1 sec bins | Bins with >0 counts | Bins with >2000 counts | High rate bins dominated by noise | Noise dominated (total time) | Noise dominated (detector-on time) | Marked lightcurve |
|---|---|---|---|---|---|---|---|
| A | 29740 | 25277 | 679 | 679 | 2.28% | 2.69% |  |
| B | 29740 | 25277 | 42 | 42 | 0.14% | 0.17% |  |
| C | 29740 | 25278 | 522 | 522 | 1.76% | 2.07% | 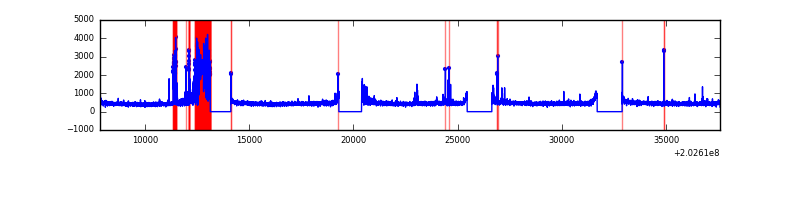 |
| D | 29740 | 25278 | 117 | 117 | 0.39% | 0.46% |  |
Top three noisy pixels from each quadrant. If the there are fewer than three noisy pixels in the level2.evt file, extra rows are filled as -1
| Pixel properties | Quadrant properties | ||||||
|---|---|---|---|---|---|---|---|
| Quadrant | DetID | PixID | Counts | Sigma | Mean | Median | Sigma |
| A | 13 | 251 | 3088120 | 5099.52 | 2986 | 2920 | 605.0 |
| A | 13 | 164 | 426395 | 699.96 | 2986 | 2920 | 605.0 |
| A | 0 | 50 | 286804 | 469.23 | 2986 | 2920 | 605.0 |
| B | 14 | 167 | 1225521 | 2100.53 | 3052 | 2978 | 582.0 |
| B | 15 | 204 | 960167 | 1644.61 | 3052 | 2978 | 582.0 |
| B | 3 | 0 | 584028 | 998.34 | 3052 | 2978 | 582.0 |
| C | 2 | 53 | 1667209 | 2494.48 | 2881 | 2892 | 667.2 |
| C | 9 | 144 | 67191 | 96.37 | 2881 | 2892 | 667.2 |
| C | 14 | 234 | 66458 | 95.27 | 2881 | 2892 | 667.2 |
| D | 2 | 37 | 392399 | 553.1 | 2929 | 2844 | 704.3 |
| D | 5 | 233 | 275659 | 387.35 | 2929 | 2844 | 704.3 |
| D | 1 | 20 | 174274 | 243.4 | 2929 | 2844 | 704.3 |
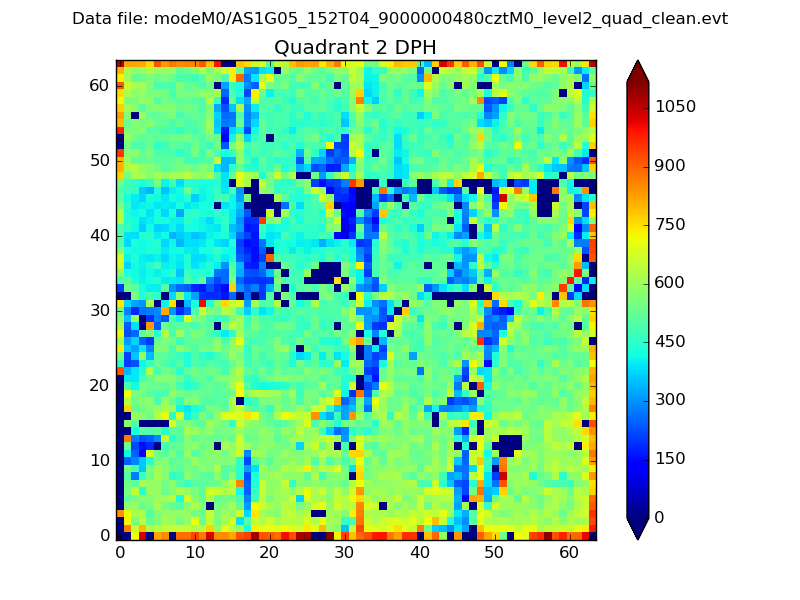
Histogram calculated using DETX and DETY for each event in the final _common_clean file
| Quadrant A |  |
 |
Quadrant B |
|---|---|---|---|
| Quadrant D | 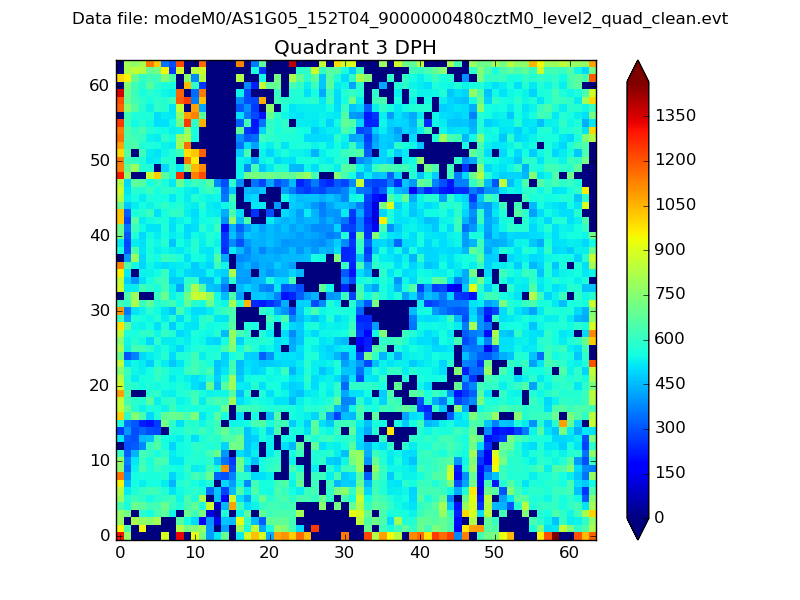 |
 |
Quadrant C |
| Plot type | Count rate plots | Images |
|---|---|---|
| Comparison with Poisson distribution Blue bars denote a histogram of data divided into 1 sec bins. Red curve is a Poisson curve with rate = median count rate of data. |
 |
 |
| Quadrant-wise count rates Data is divided into 100 sec bins |
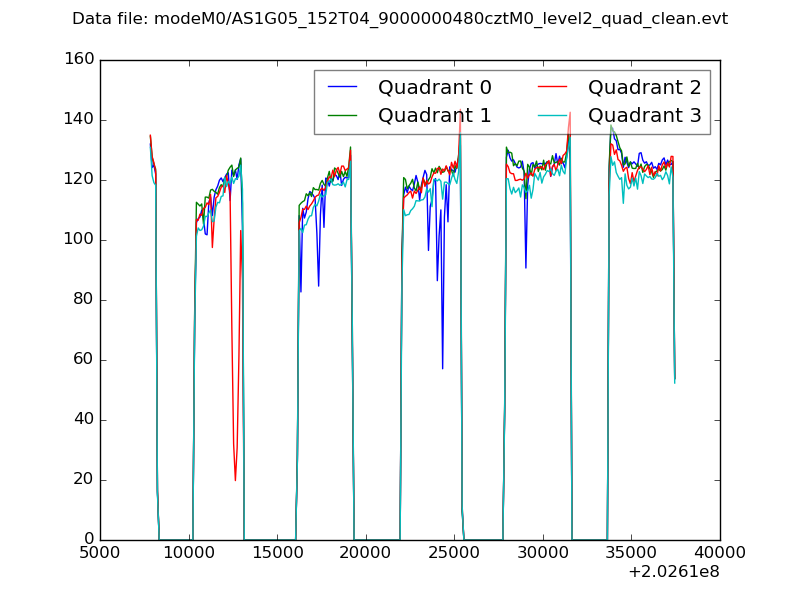 |
|
| Module-wise count rates for Quadrant A Data is divided into 100 sec bins |
 |
 |
| Module-wise count rates for Quadrant B Data is divided into 100 sec bins |
 |
 |
| Module-wise count rates for Quadrant C Data is divided into 100 sec bins |
 |
 |
| Module-wise count rates for Quadrant D Data is divided into 100 sec bins |
 |
 |
| Parameter | Plot |
|---|---|
| CZT HV Monitor |  |
| D_VDD |  |
| Temperature 1 | 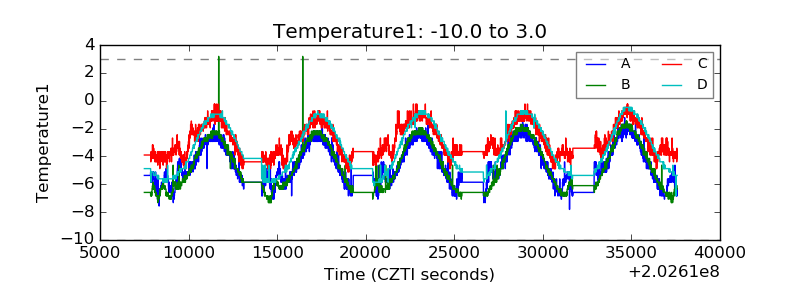 |
| Veto HV Monitor |  |
| Veto LLD |  |
| Alpha Counter |  |
| _CPM_Rate |  |
| CZT Counter |  |
| +2.5 Volts monitor |  |
| +5 Volts monitor | 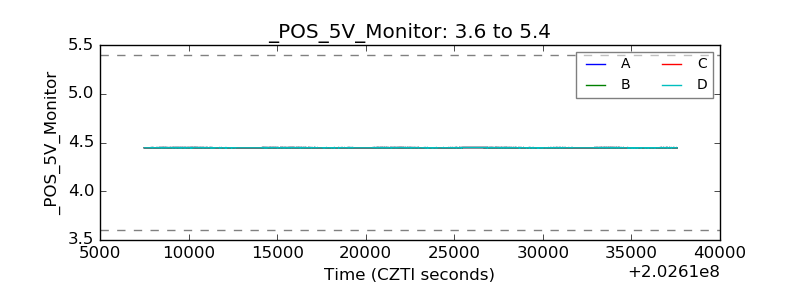 |
| _ROLL_ROT | 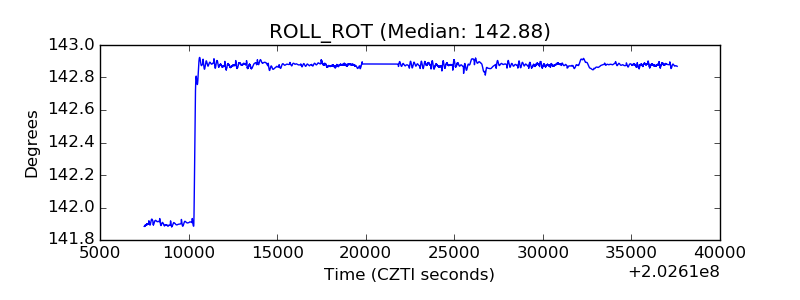 |
| _Roll_DEC |  |
| _Roll_RA |  |
| Veto Counter | 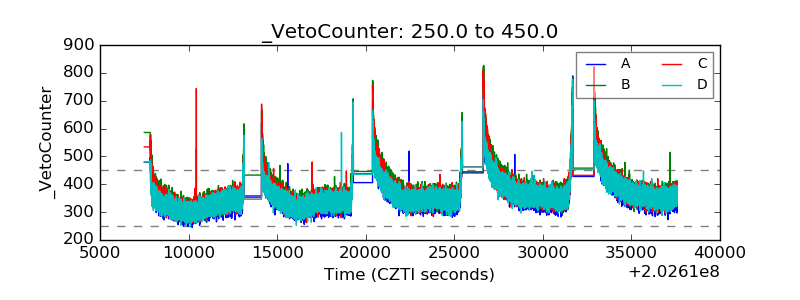 |