| Param | Original file | Final file |
|---|---|---|
| Filename | modeM0/AS1G05_191T01_9000000476cztM0_level2.evt | modeM0/AS1G05_191T01_9000000476cztM0_level2_quad_clean.evt |
| Size (bytes) | 3,755,868,480 | 696,700,800 |
| Size | 3.5 GB | 664.4 MB |
| Events in quadrant A | 28,610,682 | 4,442,314 |
| Events in quadrant B | 26,572,080 | 4,462,094 |
| Events in quadrant C | 23,943,575 | 4,428,719 |
| Events in quadrant D | 31,141,766 | 4,230,302 |
| Mode M9 | |||
|---|---|---|---|
| Quadrant | BADHDUFLAG | Total packets | Discarded packets |
| A | 0 | 63 | 0 |
| B | 0 | 63 | 0 |
| C | 0 | 63 | 0 |
| D | 0 | 63 | 0 |
| Mode M0 | |||
|---|---|---|---|
| Quadrant | BADHDUFLAG | Total packets | Discarded packets |
| A | 0 | 118827 | 0 |
| B | 0 | 112737 | 0 |
| C | 0 | 106909 | 0 |
| D | 0 | 129817 | 0 |
| Mode SS | |||
|---|---|---|---|
| Quadrant | BADHDUFLAG | Total packets | Discarded packets |
| A | 0 | 1050 | 0 |
| B | 0 | 1050 | 0 |
| C | 0 | 1050 | 0 |
| D | 0 | 1050 | 0 |
| Quadrant | Total seconds | Saturated seconds | Saturation percentage |
|---|---|---|---|
| A | 51578 | 1052 | 2.039629% |
| B | 51582 | 802 | 1.554806% |
| C | 51582 | 524 | 1.015858% |
| D | 51583 | 1965 | 3.809395% |
Noise dominated data is calculated using 1-second bins in cleaned event files. If a bin has >2000 counts, and if more than 50% of those come from <1% of pixels, then it is considered to be noise-dominated and hence unusable.
| Quadrant | # 1 sec bins | Bins with >0 counts | Bins with >2000 counts | High rate bins dominated by noise | Noise dominated (total time) | Noise dominated (detector-on time) | Marked lightcurve |
|---|---|---|---|---|---|---|---|
| A | 57889 | 51591 | 256 | 256 | 0.44% | 0.50% | 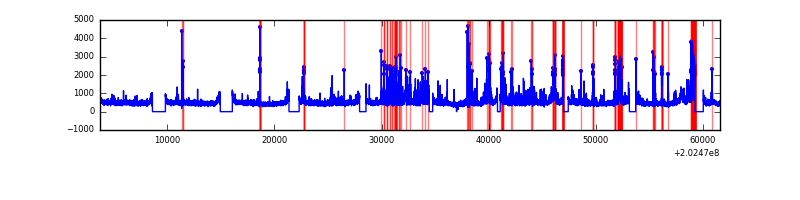 |
| B | 57889 | 51593 | 58 | 58 | 0.10% | 0.11% |  |
| C | 57889 | 51593 | 52 | 52 | 0.09% | 0.10% |  |
| D | 57889 | 51593 | 1147 | 1147 | 1.98% | 2.22% |  |
Top three noisy pixels from each quadrant. If the there are fewer than three noisy pixels in the level2.evt file, extra rows are filled as -1
| Pixel properties | Quadrant properties | ||||||
|---|---|---|---|---|---|---|---|
| Quadrant | DetID | PixID | Counts | Sigma | Mean | Median | Sigma |
| A | 13 | 164 | 2551862 | 2059.24 | 6137 | 6021 | 1236.3 |
| A | 13 | 251 | 1934354 | 1559.76 | 6137 | 6021 | 1236.3 |
| A | 0 | 50 | 158214 | 123.1 | 6137 | 6021 | 1236.3 |
| B | 15 | 204 | 1180274 | 982.14 | 6231 | 6093 | 1195.5 |
| B | 4 | 81 | 469995 | 388.03 | 6231 | 6093 | 1195.5 |
| B | 14 | 167 | 135896 | 108.57 | 6231 | 6093 | 1195.5 |
| C | 9 | 247 | 412196 | 293.0 | 5981 | 6033 | 1386.2 |
| C | 1 | 16 | 77648 | 51.66 | 5981 | 6033 | 1386.2 |
| C | 13 | 61 | 50733 | 32.25 | 5981 | 6033 | 1386.2 |
| D | 13 | 172 | 6639988 | 4690.14 | 5905 | 5760 | 1414.5 |
| D | 13 | 223 | 1119318 | 787.24 | 5905 | 5760 | 1414.5 |
| D | 13 | 239 | 294486 | 204.12 | 5905 | 5760 | 1414.5 |
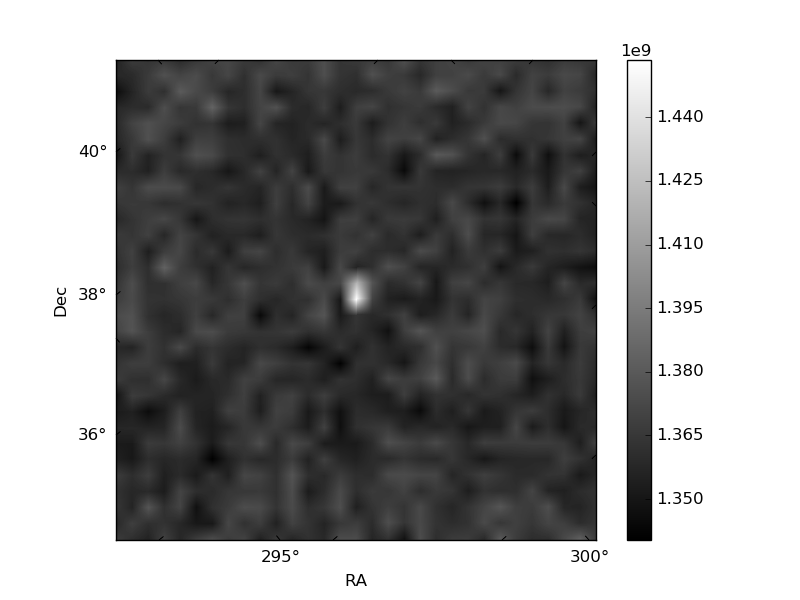
Histogram calculated using DETX and DETY for each event in the final _common_clean file
| Quadrant A |  |
 |
Quadrant B |
|---|---|---|---|
| Quadrant D |  |
 |
Quadrant C |
| Plot type | Count rate plots | Images |
|---|---|---|
| Comparison with Poisson distribution Blue bars denote a histogram of data divided into 1 sec bins. Red curve is a Poisson curve with rate = median count rate of data. |
 |
 |
| Quadrant-wise count rates Data is divided into 100 sec bins |
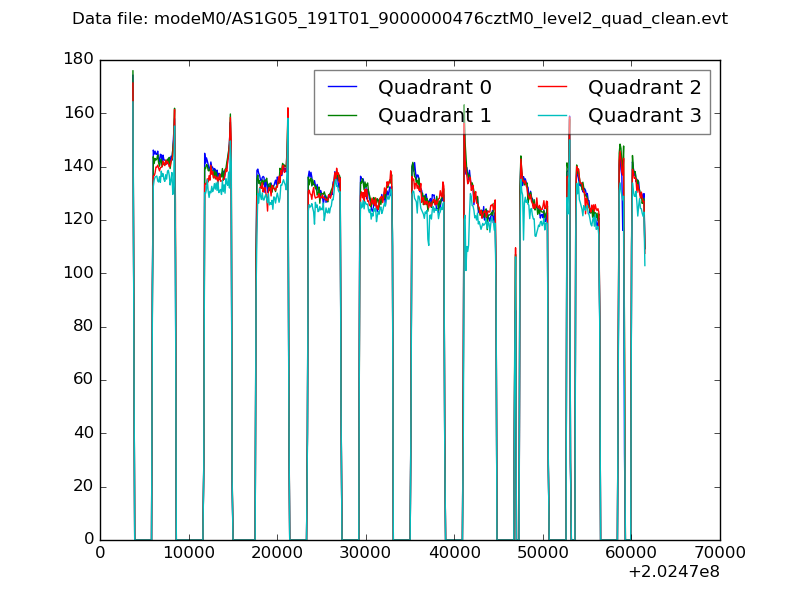 |
|
| Module-wise count rates for Quadrant A Data is divided into 100 sec bins |
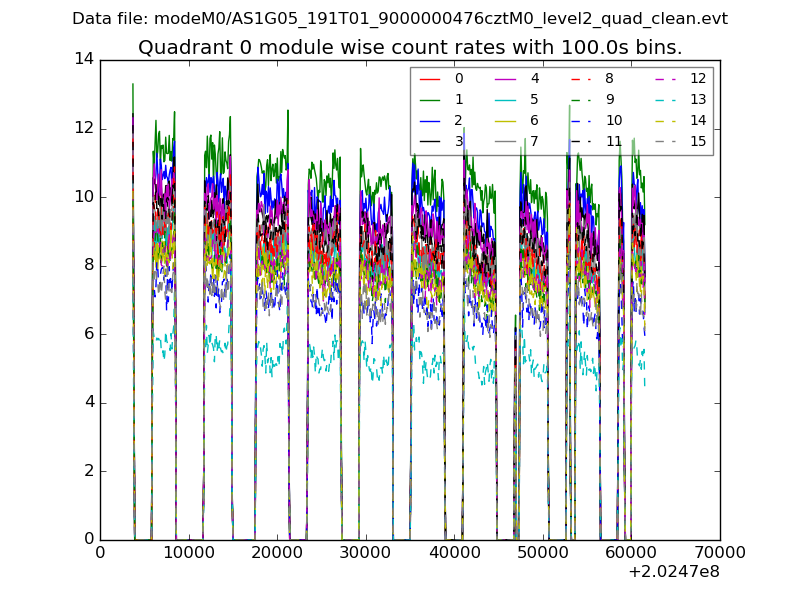 |
 |
| Module-wise count rates for Quadrant B Data is divided into 100 sec bins |
 |
 |
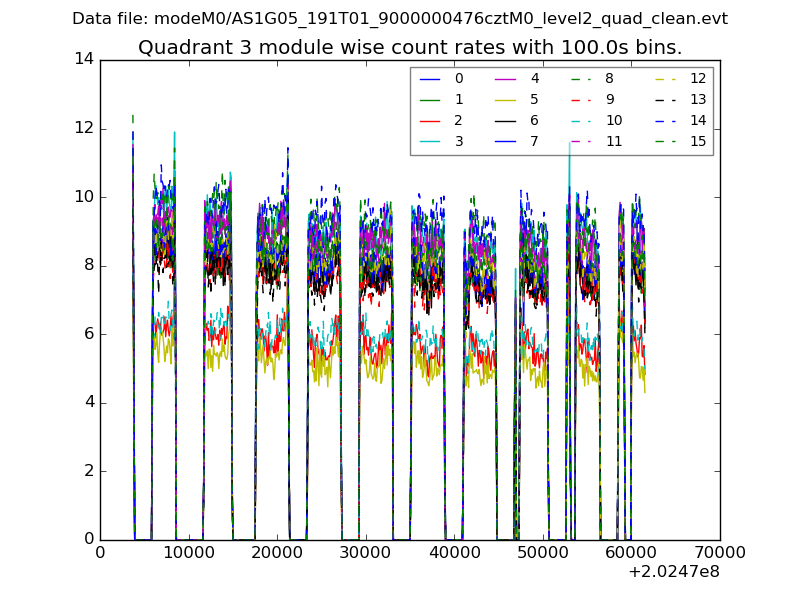
| Module-wise count rates for Quadrant C Data is divided into 100 sec bins |
 |
 |
| Module-wise count rates for Quadrant D Data is divided into 100 sec bins |
 |
 |
| Parameter | Plot |
|---|---|
| CZT HV Monitor |  |
| D_VDD | 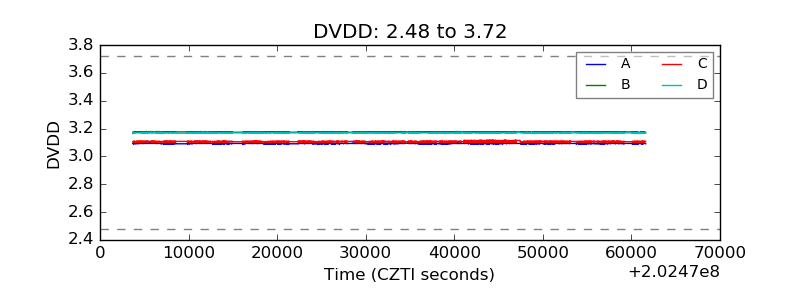 |
| Temperature 1 |  |
| Veto HV Monitor | 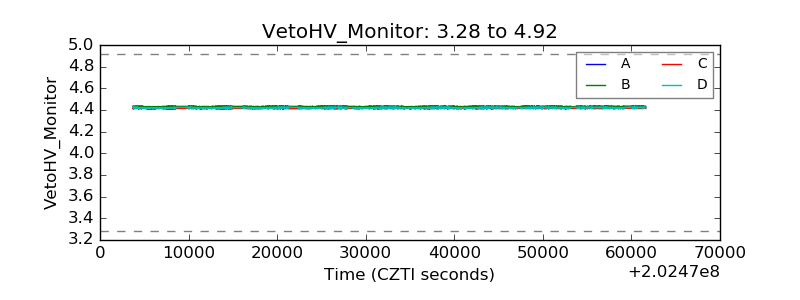 |
| Veto LLD |  |
| Alpha Counter |  |
| _CPM_Rate | 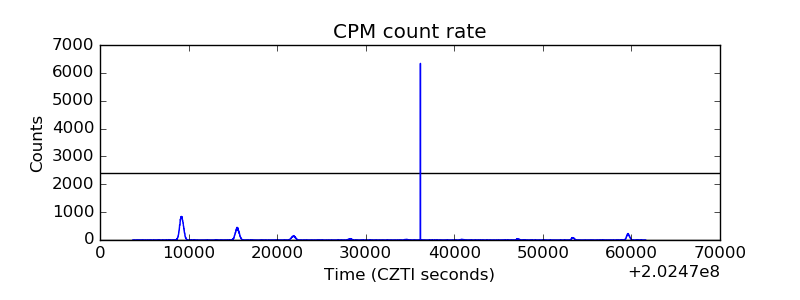 |
| CZT Counter |  |
| +2.5 Volts monitor |  |
| +5 Volts monitor |  |
| _ROLL_ROT |  |
| _Roll_DEC |  |
| _Roll_RA |  |
| Veto Counter |  |