| Param | Original file | Final file |
|---|---|---|
| Filename | modeM0/AS1G05_234T02_9000000474cztM0_level2.evt | modeM0/AS1G05_234T02_9000000474cztM0_level2_quad_clean.evt |
| Size (bytes) | 995,221,440 | 207,987,840 |
| Size | 949.1 MB | 198.4 MB |
| Events in quadrant A | 7,353,444 | 1,343,064 |
| Events in quadrant B | 8,537,854 | 1,334,814 |
| Events in quadrant C | 6,481,714 | 1,326,127 |
| Events in quadrant D | 6,780,725 | 1,289,428 |
| Mode M9 | |||
|---|---|---|---|
| Quadrant | BADHDUFLAG | Total packets | Discarded packets |
| A | 0 | 29 | 0 |
| B | 0 | 29 | 0 |
| C | 0 | 29 | 0 |
| D | 0 | 30 | 0 |
| Mode SS | |||
|---|---|---|---|
| Quadrant | BADHDUFLAG | Total packets | Discarded packets |
| A | 0 | 294 | 0 |
| B | 0 | 296 | 0 |
| C | 0 | 296 | 0 |
| D | 0 | 296 | 0 |
| Mode M0 | |||
|---|---|---|---|
| Quadrant | BADHDUFLAG | Total packets | Discarded packets |
| A | 0 | 31684 | 0 |
| B | 0 | 34745 | 0 |
| C | 0 | 29639 | 0 |
| D | 0 | 30720 | 0 |
| Quadrant | Total seconds | Saturated seconds | Saturation percentage |
|---|---|---|---|
| A | 14583 | 245 | 1.680038% |
| B | 14572 | 310 | 2.127368% |
| C | 14577 | 108 | 0.740893% |
| D | 14584 | 173 | 1.186231% |
Noise dominated data is calculated using 1-second bins in cleaned event files. If a bin has >2000 counts, and if more than 50% of those come from <1% of pixels, then it is considered to be noise-dominated and hence unusable.
| Quadrant | # 1 sec bins | Bins with >0 counts | Bins with >2000 counts | High rate bins dominated by noise | Noise dominated (total time) | Noise dominated (detector-on time) | Marked lightcurve |
|---|---|---|---|---|---|---|---|
| A | 16851 | 14588 | 77 | 77 | 0.46% | 0.53% |  |
| B | 16851 | 14577 | 154 | 154 | 0.91% | 1.06% | 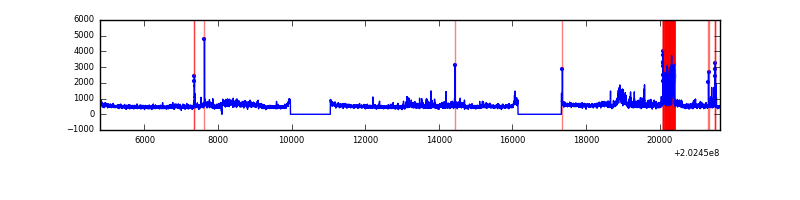 |
| C | 16851 | 14582 | 2 | 2 | 0.01% | 0.01% |  |
| D | 16851 | 14588 | 56 | 56 | 0.33% | 0.38% |  |
Top three noisy pixels from each quadrant. If the there are fewer than three noisy pixels in the level2.evt file, extra rows are filled as -1
| Pixel properties | Quadrant properties | ||||||
|---|---|---|---|---|---|---|---|
| Quadrant | DetID | PixID | Counts | Sigma | Mean | Median | Sigma |
| A | 13 | 164 | 293110 | 844.56 | 1708 | 1670 | 345.1 |
| A | 0 | 50 | 271818 | 782.85 | 1708 | 1670 | 345.1 |
| A | 13 | 251 | 135856 | 388.85 | 1708 | 1670 | 345.1 |
| B | 15 | 204 | 1106084 | 3359.86 | 1719 | 1679 | 328.7 |
| B | 14 | 167 | 435075 | 1318.49 | 1719 | 1679 | 328.7 |
| B | 0 | 182 | 90656 | 270.69 | 1719 | 1679 | 328.7 |
| C | 13 | 61 | 13980 | 32.27 | 1649 | 1653 | 382.0 |
| C | 7 | 220 | 13509 | 31.04 | 1649 | 1653 | 382.0 |
| C | 9 | 247 | 13103 | 29.98 | 1649 | 1653 | 382.0 |
| D | 13 | 239 | 174481 | 434.41 | 1654 | 1611 | 397.9 |
| D | 13 | 223 | 125380 | 311.02 | 1654 | 1611 | 397.9 |
| D | 14 | 34 | 36316 | 87.21 | 1654 | 1611 | 397.9 |
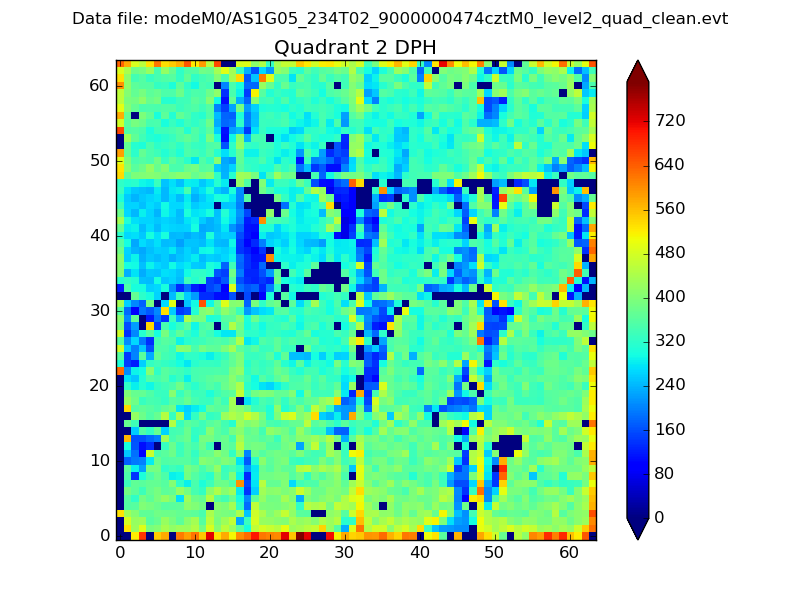
Histogram calculated using DETX and DETY for each event in the final _common_clean file
| Quadrant A |  |
 |
Quadrant B |
|---|---|---|---|
| Quadrant D |  |
 |
Quadrant C |
| Plot type | Count rate plots | Images |
|---|---|---|
| Comparison with Poisson distribution Blue bars denote a histogram of data divided into 1 sec bins. Red curve is a Poisson curve with rate = median count rate of data. |
 |
 |
| Quadrant-wise count rates Data is divided into 100 sec bins |
 |
|
| Module-wise count rates for Quadrant A Data is divided into 100 sec bins |
 |
 |
| Module-wise count rates for Quadrant B Data is divided into 100 sec bins |
 |
 |
| Module-wise count rates for Quadrant C Data is divided into 100 sec bins |
 |
 |
| Module-wise count rates for Quadrant D Data is divided into 100 sec bins |
 |
 |
| Parameter | Plot |
|---|---|
| CZT HV Monitor |  |
| D_VDD |  |
| Temperature 1 |  |
| Veto HV Monitor |  |
| Veto LLD | 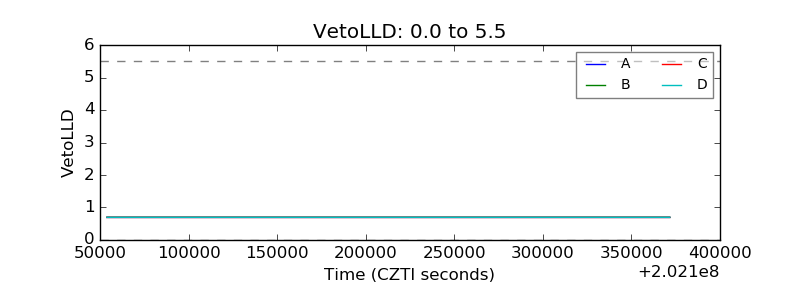 |
| Alpha Counter | 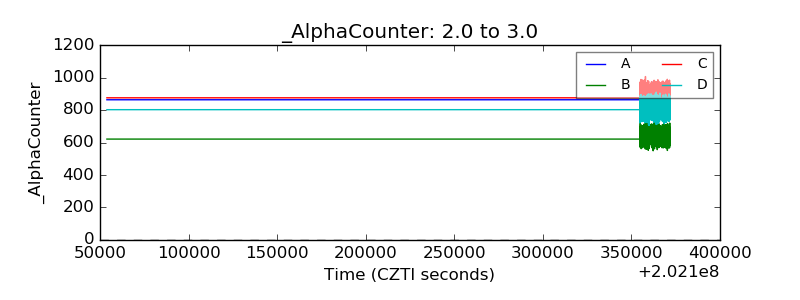 |
| _CPM_Rate |  |
| CZT Counter |  |
| +2.5 Volts monitor |  |
| +5 Volts monitor |  |
| _ROLL_ROT | 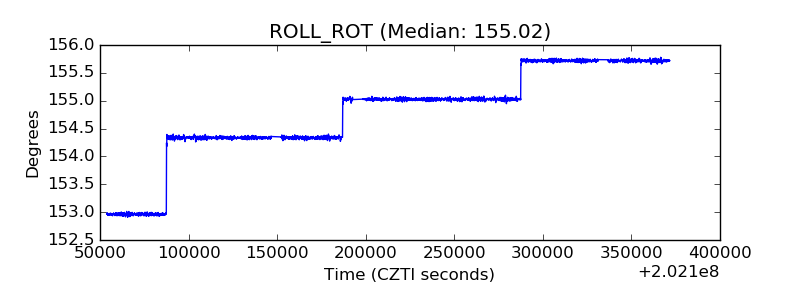 |
| _Roll_DEC |  |
| _Roll_RA |  |
| Veto Counter | 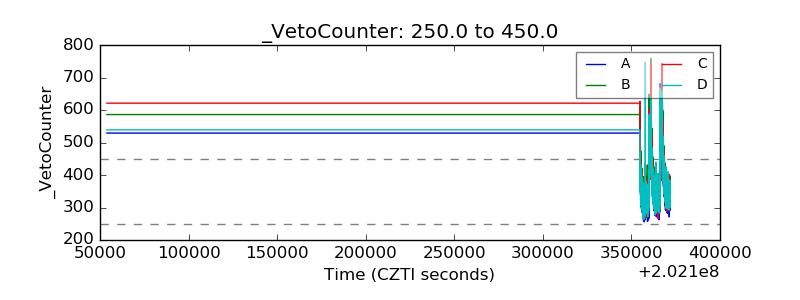 |