| Param | Original file | Final file |
|---|---|---|
| Filename | modeM0/AS1G05_246T04_9000000472cztM0_level2_bc.evt | modeM0/AS1G05_246T04_9000000472cztM0_level2_quad_clean.evt |
| Size (bytes) | 2,324,540,160 | 756,394,560 |
| Size | 2.2 GB | 721.4 MB |
| Events in quadrant A | 14,830,949 | 4,737,418 |
| Events in quadrant B | 16,221,568 | 4,736,797 |
| Events in quadrant C | 22,221,227 | 4,575,017 |
| Events in quadrant D | 12,876,897 | 4,585,070 |
| Mode M0 | |||
|---|---|---|---|
| Quadrant | BADHDUFLAG | Total packets | Discarded packets |
| A | 0 | 136164 | 0 |
| B | 0 | 139538 | 0 |
| C | 0 | 167847 | 0 |
| D | 0 | 131117 | 0 |
| Mode SS | |||
|---|---|---|---|
| Quadrant | BADHDUFLAG | Total packets | Discarded packets |
| A | 0 | 1268 | 0 |
| B | 0 | 1268 | 0 |
| C | 0 | 1268 | 0 |
| D | 0 | 1268 | 0 |
| Mode M9 | |||
|---|---|---|---|
| Quadrant | BADHDUFLAG | Total packets | Discarded packets |
| A | 0 | 94 | 0 |
| B | 0 | 94 | 0 |
| C | 0 | 94 | 0 |
| D | 0 | 94 | 0 |
| Quadrant | Total seconds | Saturated seconds | Saturation percentage |
|---|---|---|---|
| A | 62344 | 885 | 1.419543% |
| B | 62345 | 842 | 1.350549% |
| C | 62344 | 3391 | 5.439176% |
| D | 62346 | 687 | 1.101915% |
Noise dominated data is calculated using 1-second bins in cleaned event files. If a bin has >2000 counts, and if more than 50% of those come from <1% of pixels, then it is considered to be noise-dominated and hence unusable.
| Quadrant | # 1 sec bins | Bins with >0 counts | Bins with >2000 counts | High rate bins dominated by noise | Noise dominated (total time) | Noise dominated (detector-on time) | Marked lightcurve |
|---|---|---|---|---|---|---|---|
| A | 71560 | 62350 | 22 | 22 | 0.03% | 0.04% |  |
| B | 71560 | 62345 | 29 | 29 | 0.04% | 0.05% |  |
| C | 71560 | 62348 | 80 | 80 | 0.11% | 0.13% |  |
| D | 71560 | 62349 | 31 | 31 | 0.04% | 0.05% | 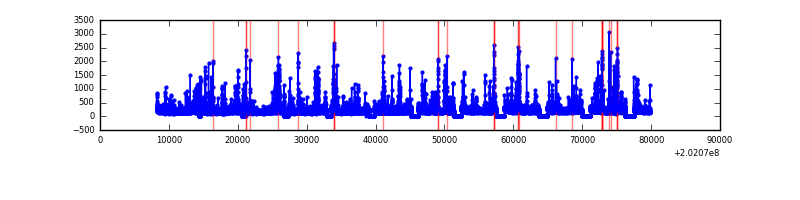 |
Top three noisy pixels from each quadrant. If the there are fewer than three noisy pixels in the level2.evt file, extra rows are filled as -1
| Pixel properties | Quadrant properties | ||||||
|---|---|---|---|---|---|---|---|
| Quadrant | DetID | PixID | Counts | Sigma | Mean | Median | Sigma |
| A | 8 | 15 | 2312253 | 3502.48 | 2982 | 2916 | 659.3 |
| A | 0 | 50 | 514861 | 776.45 | 2982 | 2916 | 659.3 |
| A | 3 | 1 | 210080 | 314.2 | 2982 | 2916 | 659.3 |
| B | 15 | 204 | 3305722 | 5684.13 | 3006 | 2911 | 581.1 |
| B | 4 | 81 | 348113 | 594.09 | 3006 | 2911 | 581.1 |
| B | 14 | 167 | 217535 | 369.37 | 3006 | 2911 | 581.1 |
| C | 2 | 53 | 8109457 | 12547.7 | 2881 | 2829 | 646.1 |
| C | 9 | 247 | 2390089 | 3695.08 | 2881 | 2829 | 646.1 |
| C | 1 | 16 | 199045 | 303.71 | 2881 | 2829 | 646.1 |
| D | 13 | 223 | 446349 | 646.43 | 2965 | 2846 | 686.1 |
| D | 13 | 239 | 178877 | 256.57 | 2965 | 2846 | 686.1 |
| D | 10 | 172 | 169353 | 242.69 | 2965 | 2846 | 686.1 |
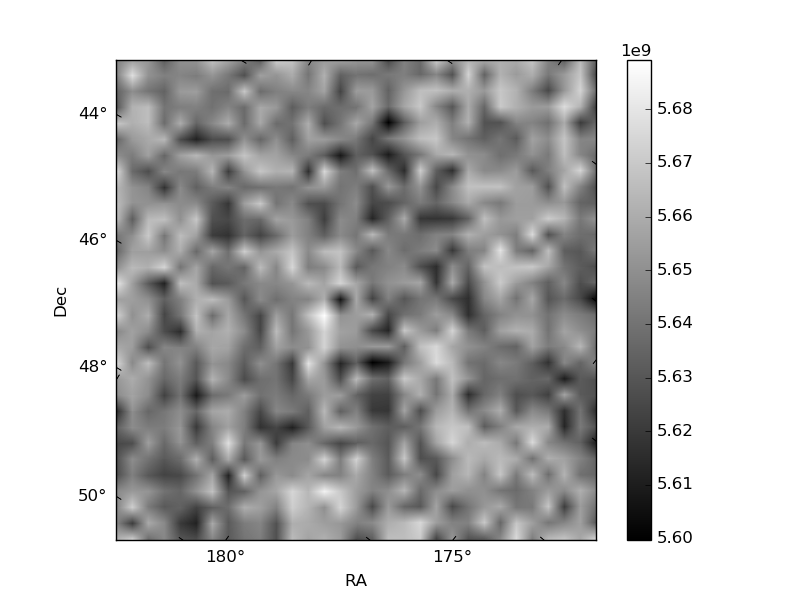
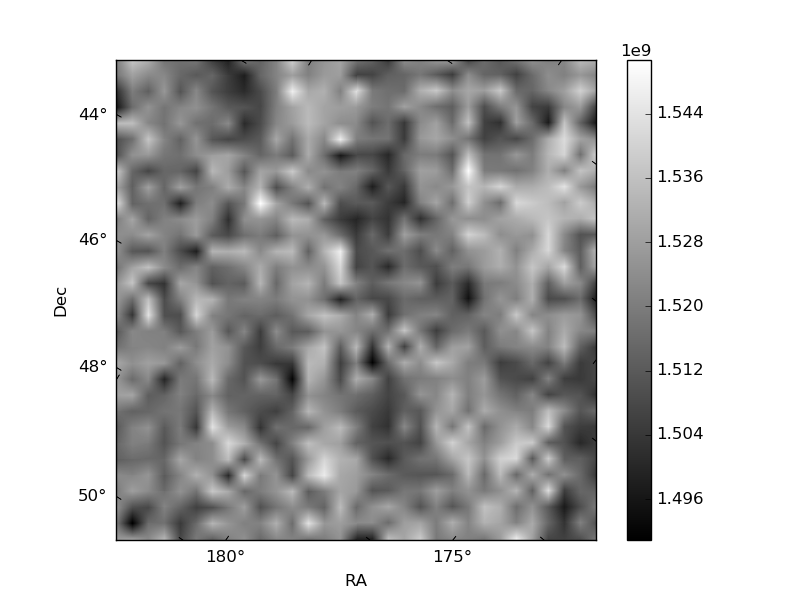
Histogram calculated using DETX and DETY for each event in the final _common_clean file
| Quadrant A | 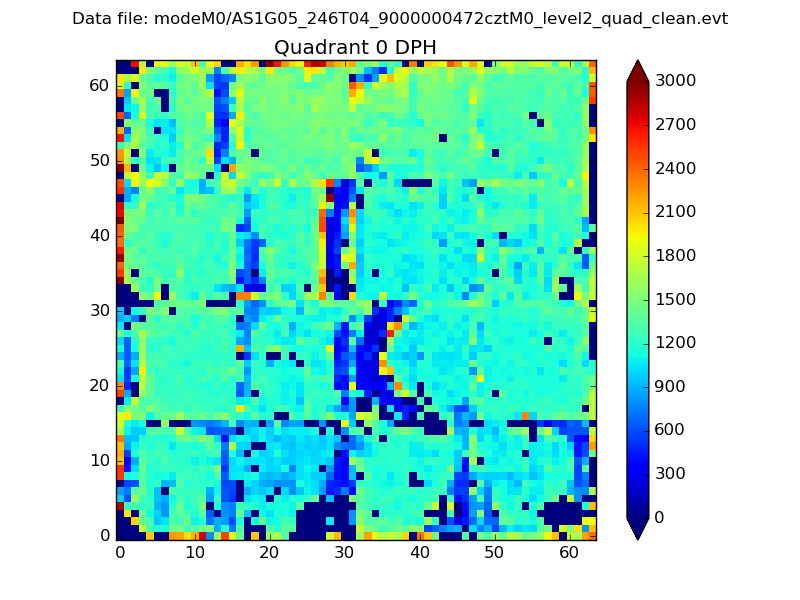 |
 |
Quadrant B |
|---|---|---|---|
| Quadrant D | 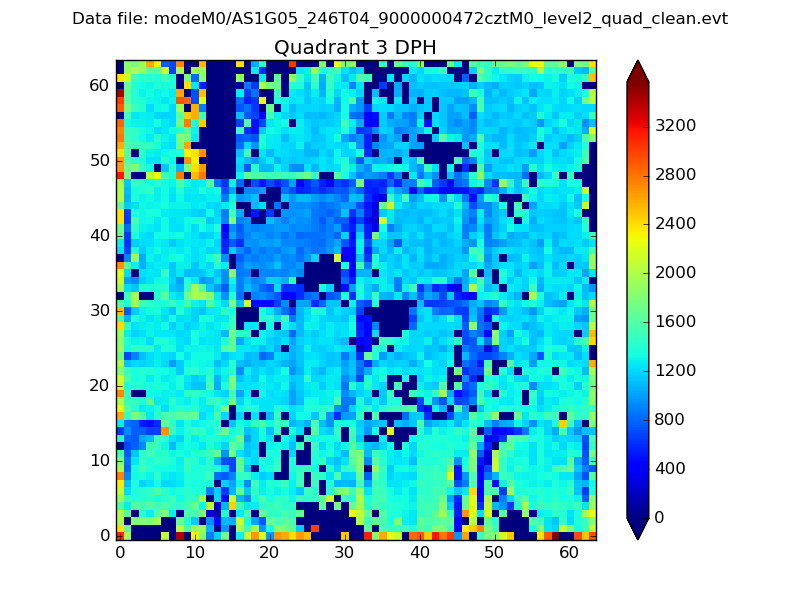 |
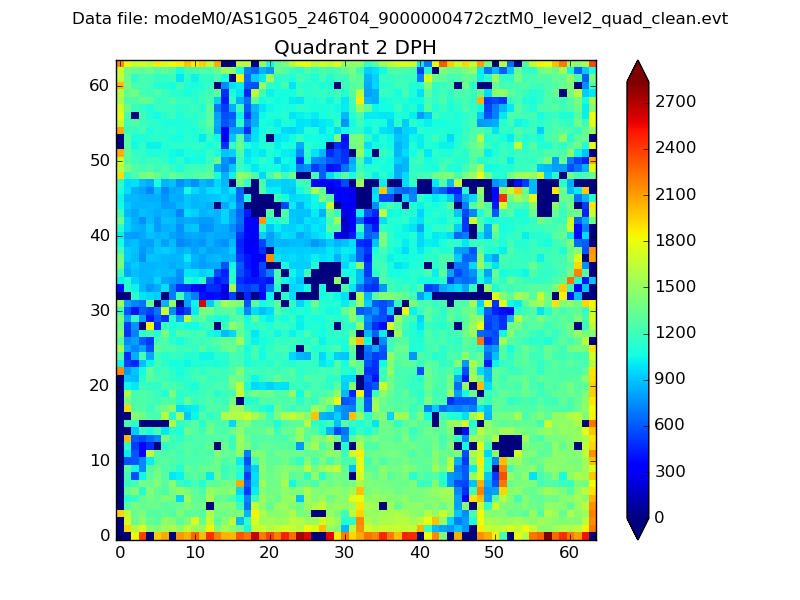 |
Quadrant C |
| Plot type | Count rate plots | Images |
|---|---|---|
| Comparison with Poisson distribution Blue bars denote a histogram of data divided into 1 sec bins. Red curve is a Poisson curve with rate = median count rate of data. |
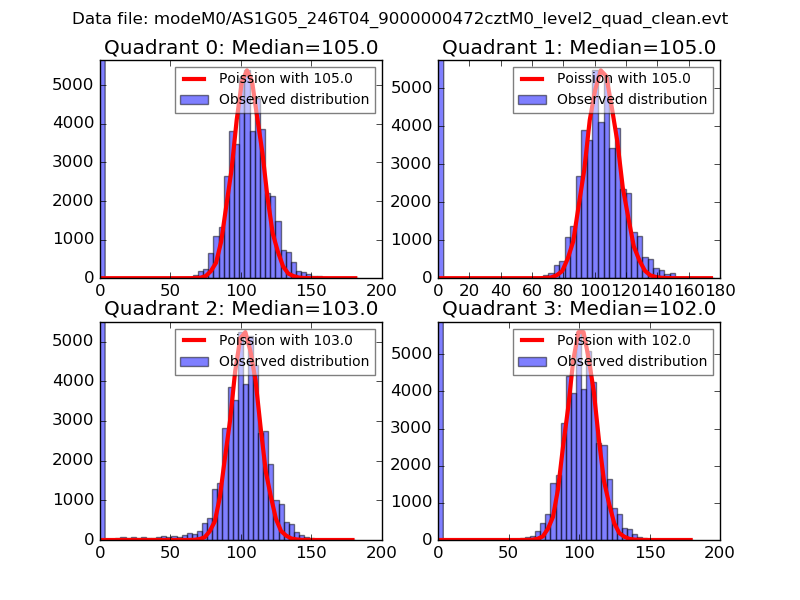 |
 |
| Quadrant-wise count rates Data is divided into 100 sec bins |
 |
|
| Module-wise count rates for Quadrant A Data is divided into 100 sec bins |
 |
 |
| Module-wise count rates for Quadrant B Data is divided into 100 sec bins |
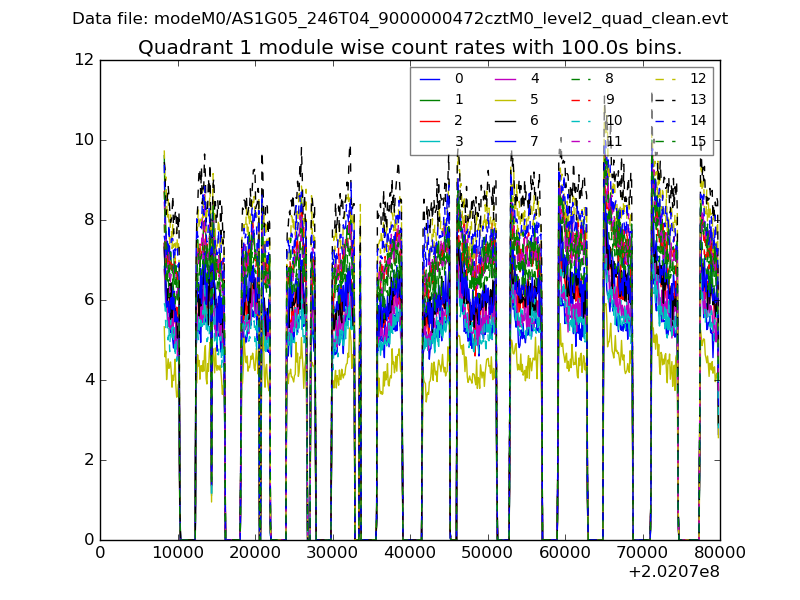 |
 |
| Module-wise count rates for Quadrant C Data is divided into 100 sec bins |
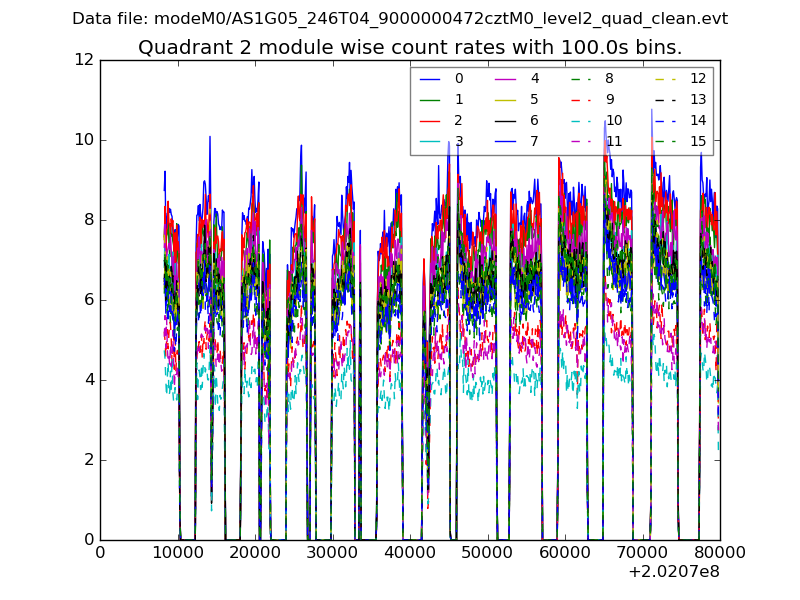 |
 |
| Module-wise count rates for Quadrant D Data is divided into 100 sec bins |
 |
 |
| Parameter | Plot |
|---|---|
| CZT HV Monitor |  |
| D_VDD |  |
| Temperature 1 |  |
| Veto HV Monitor | 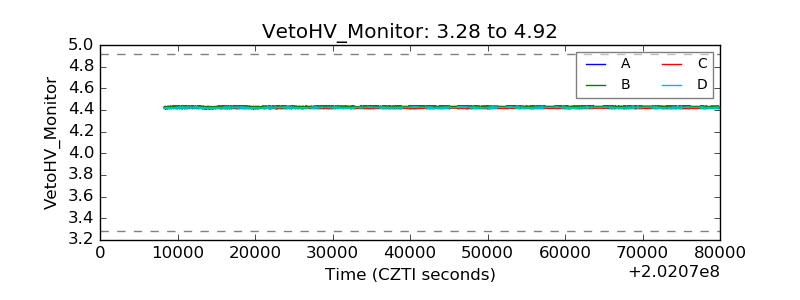 |
| Veto LLD |  |
| Alpha Counter | 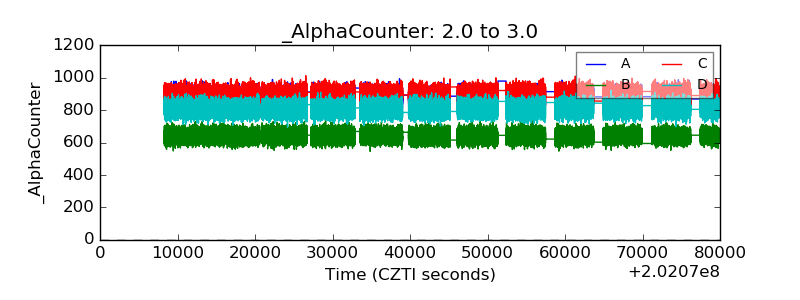 |
| _CPM_Rate |  |
| CZT Counter |  |
| +2.5 Volts monitor |  |
| +5 Volts monitor | 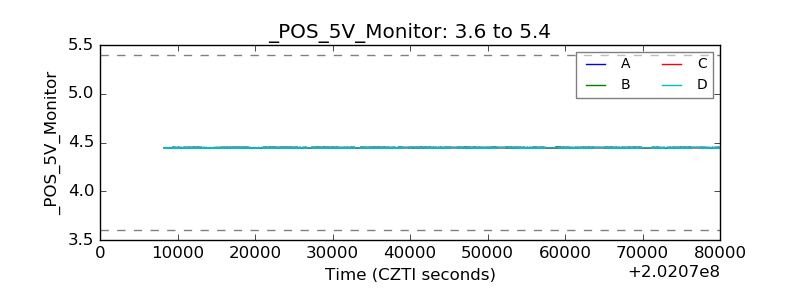 |
| _ROLL_ROT |  |
| _Roll_DEC |  |
| _Roll_RA | 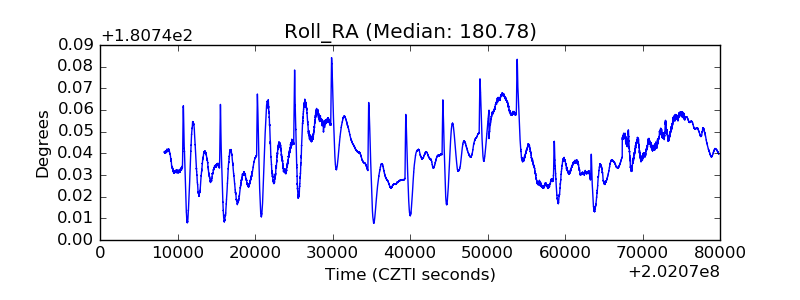 |
| Veto Counter | 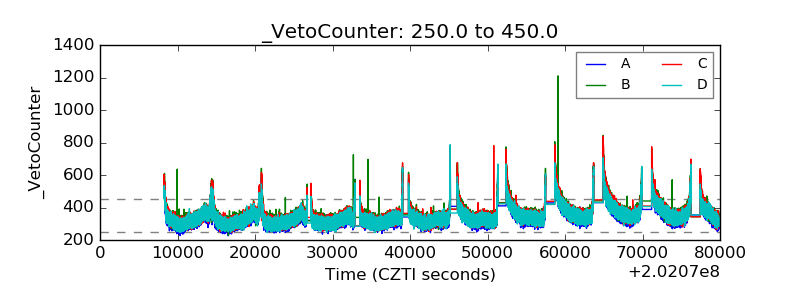 |