| Param | Original file | Final file |
|---|---|---|
| Filename | modeM0/AS1G05_246T03_9000000470cztM0_level2_bc.evt | modeM0/AS1G05_246T03_9000000470cztM0_level2_quad_clean.evt |
| Size (bytes) | 2,168,772,480 | 719,167,680 |
| Size | 2.0 GB | 685.9 MB |
| Events in quadrant A | 12,954,234 | 4,389,751 |
| Events in quadrant B | 15,862,198 | 4,409,670 |
| Events in quadrant C | 18,233,788 | 4,297,863 |
| Events in quadrant D | 14,230,990 | 4,260,064 |
| Mode M0 | |||
|---|---|---|---|
| Quadrant | BADHDUFLAG | Total packets | Discarded packets |
| A | 0 | 134143 | 0 |
| B | 0 | 141204 | 0 |
| C | 0 | 156547 | 0 |
| D | 0 | 137836 | 0 |
| Mode M9 | |||
|---|---|---|---|
| Quadrant | BADHDUFLAG | Total packets | Discarded packets |
| A | 0 | 106 | 0 |
| B | 0 | 106 | 0 |
| C | 0 | 106 | 0 |
| D | 0 | 106 | 0 |
| Mode SS | |||
|---|---|---|---|
| Quadrant | BADHDUFLAG | Total packets | Discarded packets |
| A | 0 | 1314 | 0 |
| B | 0 | 1314 | 0 |
| C | 0 | 1314 | 0 |
| D | 0 | 1314 | 0 |
| Quadrant | Total seconds | Saturated seconds | Saturation percentage |
|---|---|---|---|
| A | 64517 | 821 | 1.272533% |
| B | 64517 | 902 | 1.398081% |
| C | 64517 | 3244 | 5.028132% |
| D | 64517 | 927 | 1.436831% |
Noise dominated data is calculated using 1-second bins in cleaned event files. If a bin has >2000 counts, and if more than 50% of those come from <1% of pixels, then it is considered to be noise-dominated and hence unusable.
| Quadrant | # 1 sec bins | Bins with >0 counts | Bins with >2000 counts | High rate bins dominated by noise | Noise dominated (total time) | Noise dominated (detector-on time) | Marked lightcurve |
|---|---|---|---|---|---|---|---|
| A | 74947 | 64519 | 4 | 4 | 0.01% | 0.01% |  |
| B | 74947 | 64518 | 0 | 0 | 0.00% | 0.00% |  |
| C | 74947 | 64518 | 459 | 459 | 0.61% | 0.71% |  |
| D | 74947 | 64519 | 36 | 36 | 0.05% | 0.06% |  |
Top three noisy pixels from each quadrant. If the there are fewer than three noisy pixels in the level2.evt file, extra rows are filled as -1
| Pixel properties | Quadrant properties | ||||||
|---|---|---|---|---|---|---|---|
| Quadrant | DetID | PixID | Counts | Sigma | Mean | Median | Sigma |
| A | 8 | 15 | 233323 | 334.6 | 3118 | 3048 | 688.2 |
| A | 3 | 1 | 167587 | 239.08 | 3118 | 3048 | 688.2 |
| A | 0 | 50 | 156940 | 223.61 | 3118 | 3048 | 688.2 |
| B | 15 | 204 | 2536144 | 4122.59 | 3160 | 3063 | 614.4 |
| B | 4 | 81 | 433692 | 700.85 | 3160 | 3063 | 614.4 |
| B | 0 | 229 | 150897 | 240.6 | 3160 | 3063 | 614.4 |
| C | 2 | 53 | 2775102 | 4093.93 | 3035 | 2986 | 677.1 |
| C | 15 | 208 | 1673632 | 2467.25 | 3035 | 2986 | 677.1 |
| C | 7 | 220 | 1567984 | 2311.23 | 3035 | 2986 | 677.1 |
| D | 1 | 84 | 564303 | 787.31 | 3110 | 2988 | 713.0 |
| D | 13 | 223 | 556634 | 776.55 | 3110 | 2988 | 713.0 |
| D | 14 | 34 | 340408 | 473.27 | 3110 | 2988 | 713.0 |
Histogram calculated using DETX and DETY for each event in the final _common_clean file
| Quadrant A | 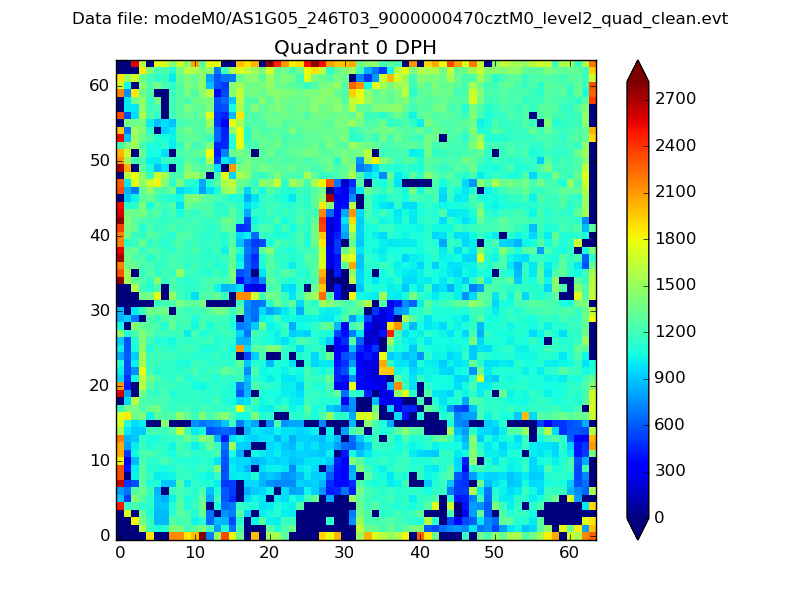 |
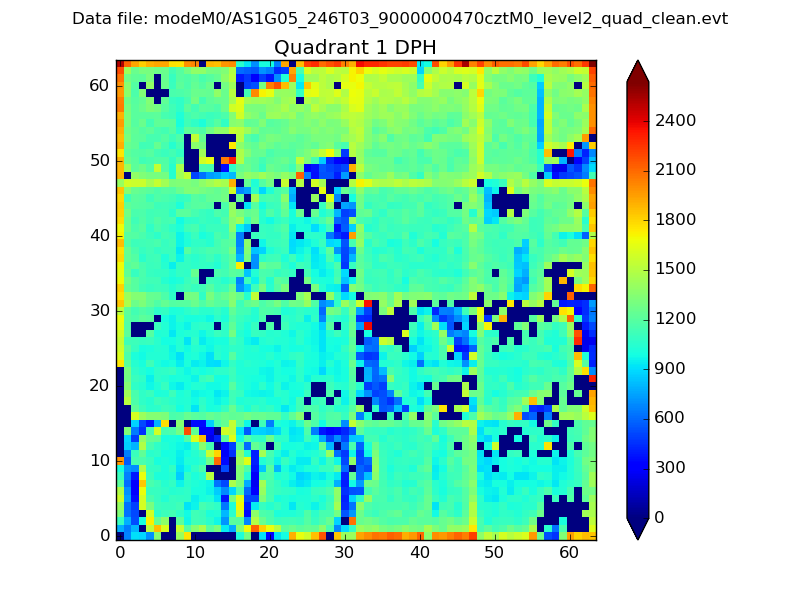 |
Quadrant B |
|---|---|---|---|
| Quadrant D |  |
 |
Quadrant C |
| Plot type | Count rate plots | Images |
|---|---|---|
| Comparison with Poisson distribution Blue bars denote a histogram of data divided into 1 sec bins. Red curve is a Poisson curve with rate = median count rate of data. |
 |
 |
| Quadrant-wise count rates Data is divided into 100 sec bins |
 |
|
| Module-wise count rates for Quadrant A Data is divided into 100 sec bins |
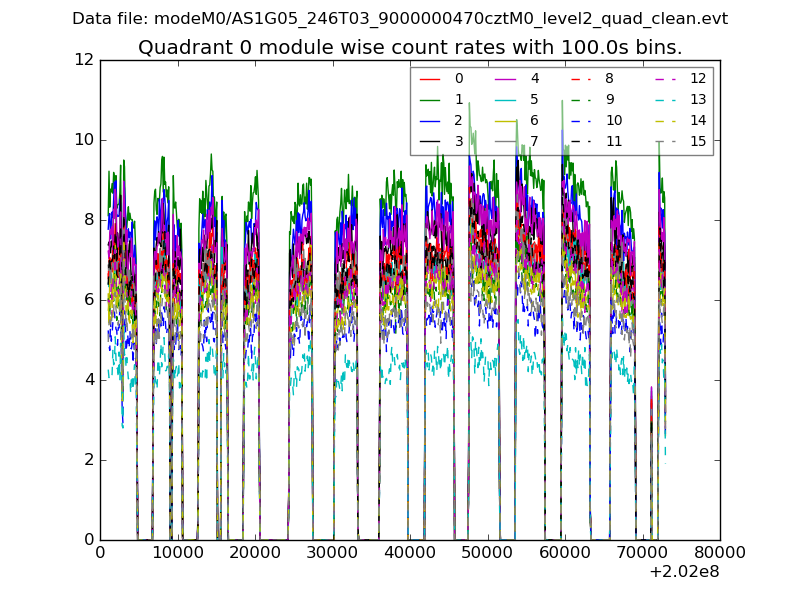 |
 |
| Module-wise count rates for Quadrant B Data is divided into 100 sec bins |
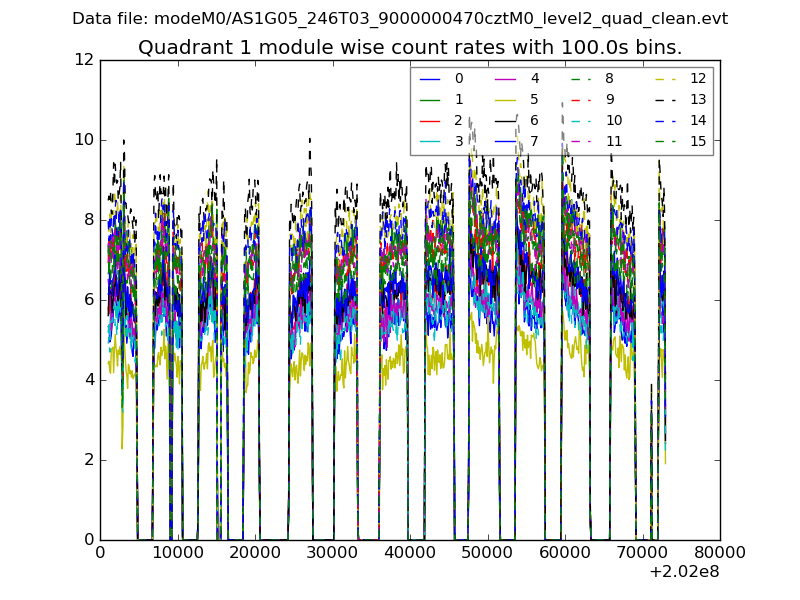 |
 |
| Module-wise count rates for Quadrant C Data is divided into 100 sec bins |
 |
 |
| Module-wise count rates for Quadrant D Data is divided into 100 sec bins |
 |
 |
| Parameter | Plot |
|---|---|
| CZT HV Monitor |  |
| D_VDD |  |
| Temperature 1 |  |
| Veto HV Monitor | 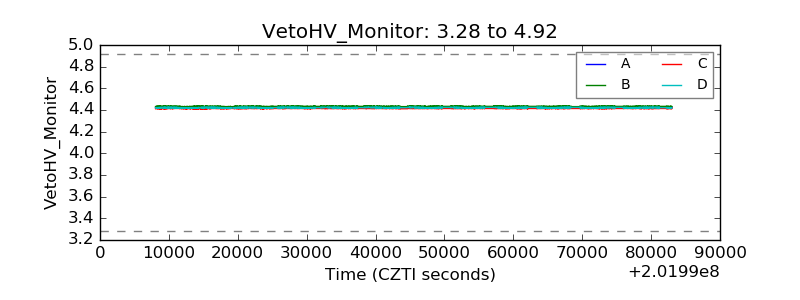 |
| Veto LLD |  |
| Alpha Counter |  |
| _CPM_Rate |  |
| CZT Counter |  |
| +2.5 Volts monitor |  |
| +5 Volts monitor |  |
| _ROLL_ROT |  |
| _Roll_DEC |  |
| _Roll_RA |  |
| Veto Counter |  |