| Param | Original file | Final file |
|---|---|---|
| Filename | modeM0/AS1G05_045T01_9000000468cztM0_level2_bc.evt | modeM0/AS1G05_045T01_9000000468cztM0_level2_quad_clean.evt |
| Size (bytes) | 13,904,012,160 | 4,005,443,520 |
| Size | 12.9 GB | 3.7 GB |
| Events in quadrant A | 79,655,107 | 24,562,481 |
| Events in quadrant B | 96,419,478 | 24,412,785 |
| Events in quadrant C | 141,076,435 | 23,688,775 |
| Events in quadrant D | 79,110,842 | 23,667,989 |
| Mode M0 | |||
|---|---|---|---|
| Quadrant | BADHDUFLAG | Total packets | Discarded packets |
| A | 0 | 783734 | 0 |
| B | 0 | 825920 | 0 |
| C | 0 | 962513 | 0 |
| D | 0 | 779365 | 0 |
| Mode M9 | |||
|---|---|---|---|
| Quadrant | BADHDUFLAG | Total packets | Discarded packets |
| A | 0 | 538 | 0 |
| B | 0 | 538 | 0 |
| C | 0 | 538 | 0 |
| D | 0 | 538 | 0 |
| Mode SS | |||
|---|---|---|---|
| Quadrant | BADHDUFLAG | Total packets | Discarded packets |
| A | 0 | 7434 | 0 |
| B | 0 | 7432 | 0 |
| C | 0 | 7434 | 0 |
| D | 0 | 7434 | 0 |
| Quadrant | Total seconds | Saturated seconds | Saturation percentage |
|---|---|---|---|
| A | 364841 | 6384 | 1.749803% |
| B | 364837 | 5913 | 1.620724% |
| C | 364739 | 22777 | 6.244739% |
| D | 364840 | 4533 | 1.242462% |
Noise dominated data is calculated using 1-second bins in cleaned event files. If a bin has >2000 counts, and if more than 50% of those come from <1% of pixels, then it is considered to be noise-dominated and hence unusable.
| Quadrant | # 1 sec bins | Bins with >0 counts | Bins with >2000 counts | High rate bins dominated by noise | Noise dominated (total time) | Noise dominated (detector-on time) | Marked lightcurve |
|---|---|---|---|---|---|---|---|
| A | 418797 | 364829 | 214 | 214 | 0.05% | 0.06% |  |
| B | 418797 | 364817 | 150 | 150 | 0.04% | 0.04% | 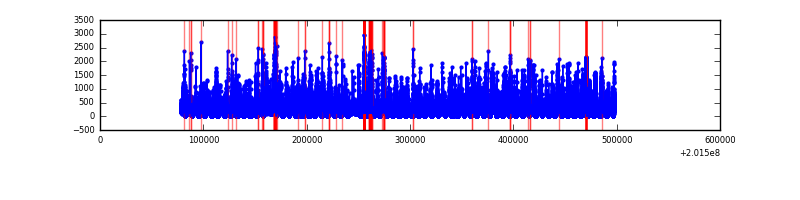 |
| C | 418797 | 364743 | 10320 | 10320 | 2.46% | 2.83% | 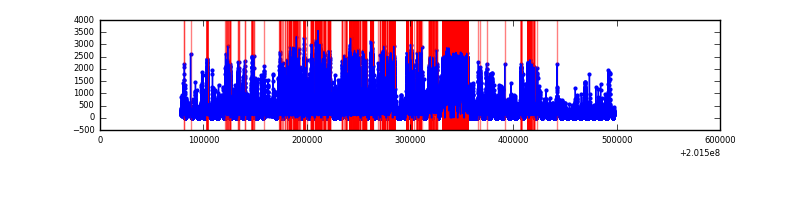 |
| D | 418797 | 364827 | 338 | 338 | 0.08% | 0.09% |  |
Top three noisy pixels from each quadrant. If the there are fewer than three noisy pixels in the level2.evt file, extra rows are filled as -1
| Pixel properties | Quadrant properties | ||||||
|---|---|---|---|---|---|---|---|
| Quadrant | DetID | PixID | Counts | Sigma | Mean | Median | Sigma |
| A | 0 | 50 | 5899961 | 1524.94 | 17289 | 16899 | 3857.9 |
| A | 8 | 15 | 3172678 | 818.01 | 17289 | 16899 | 3857.9 |
| A | 0 | 118 | 1575908 | 404.11 | 17289 | 16899 | 3857.9 |
| B | 15 | 204 | 16728346 | 4961.72 | 17441 | 16922 | 3368.1 |
| B | 14 | 167 | 3113646 | 919.43 | 17441 | 16922 | 3368.1 |
| B | 4 | 81 | 1776446 | 522.41 | 17441 | 16922 | 3368.1 |
| C | 1 | 192 | 51702222 | 13660.2 | 16792 | 16491 | 3783.7 |
| C | 4 | 248 | 14537526 | 3837.81 | 16792 | 16491 | 3783.7 |
| C | 15 | 208 | 6017123 | 1585.93 | 16792 | 16491 | 3783.7 |
| D | 1 | 20 | 2070893 | 507.82 | 17227 | 16526 | 4045.5 |
| D | 13 | 223 | 1615085 | 395.15 | 17227 | 16526 | 4045.5 |
| D | 5 | 233 | 1377655 | 336.46 | 17227 | 16526 | 4045.5 |
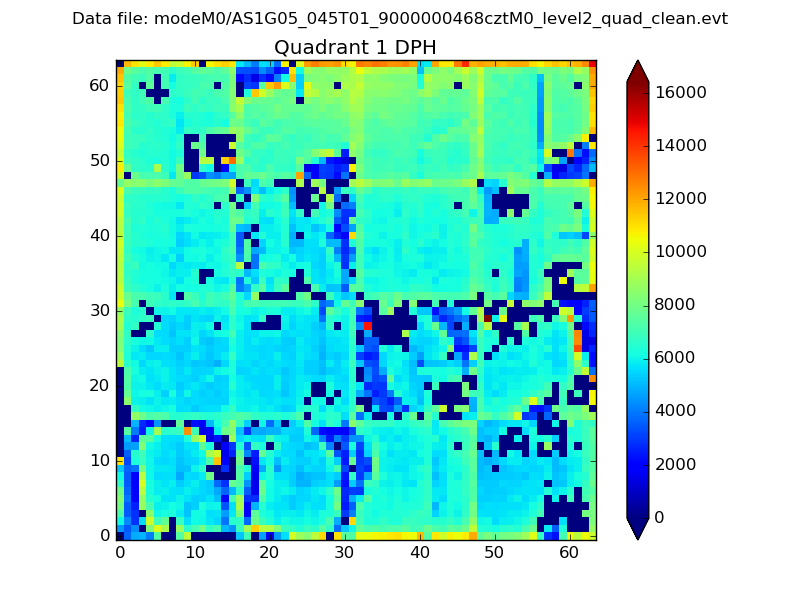
Histogram calculated using DETX and DETY for each event in the final _common_clean file
| Quadrant A |  |
 |
Quadrant B |
|---|---|---|---|
| Quadrant D |  |
 |
Quadrant C |
| Plot type | Count rate plots | Images |
|---|---|---|
| Comparison with Poisson distribution Blue bars denote a histogram of data divided into 1 sec bins. Red curve is a Poisson curve with rate = median count rate of data. |
 |
 |
| Quadrant-wise count rates Data is divided into 100 sec bins |
 |
|
| Module-wise count rates for Quadrant A Data is divided into 100 sec bins |
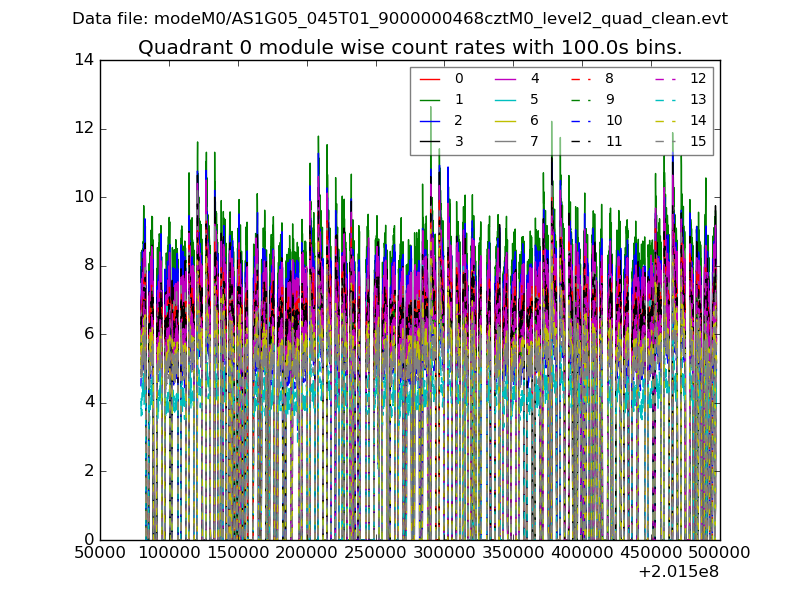 |
 |
| Module-wise count rates for Quadrant B Data is divided into 100 sec bins |
 |
 |
| Module-wise count rates for Quadrant C Data is divided into 100 sec bins |
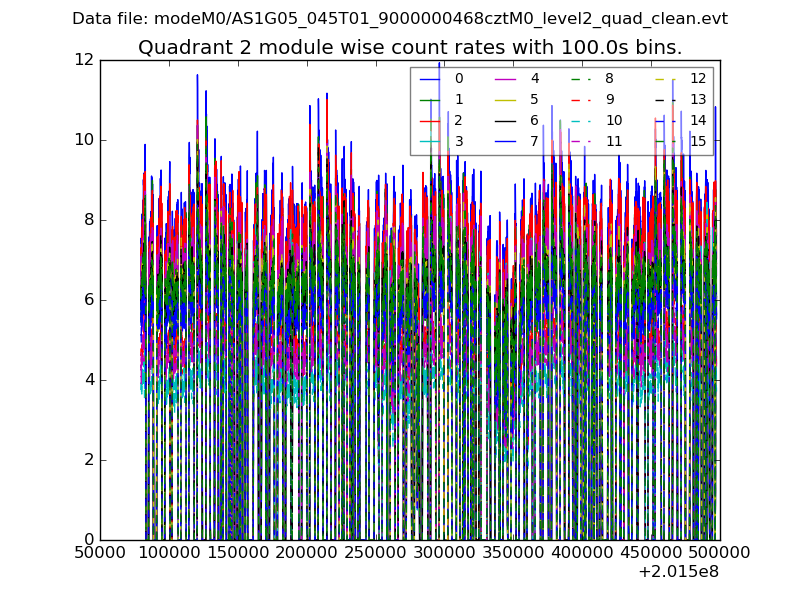 |
 |
| Module-wise count rates for Quadrant D Data is divided into 100 sec bins |
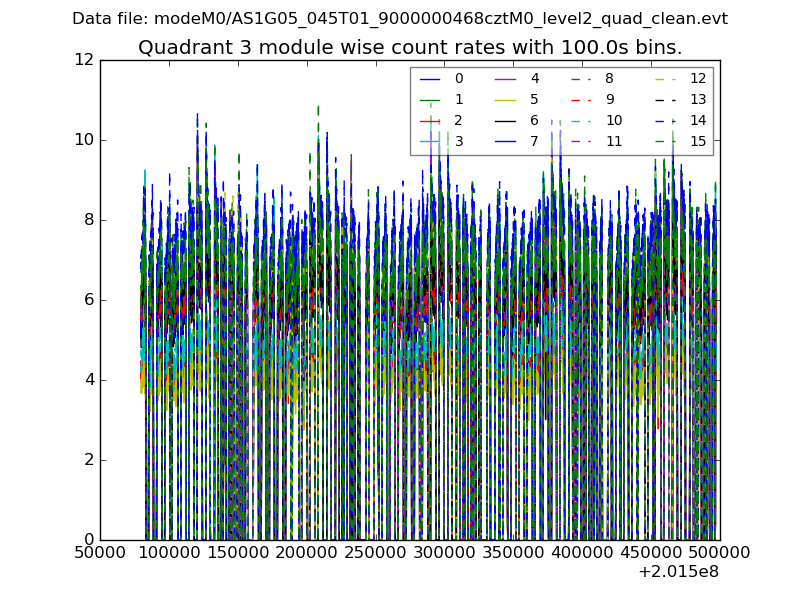 |
 |
| Parameter | Plot |
|---|---|
| CZT HV Monitor |  |
| D_VDD |  |
| Temperature 1 |  |
| Veto HV Monitor |  |
| Veto LLD |  |
| Alpha Counter | 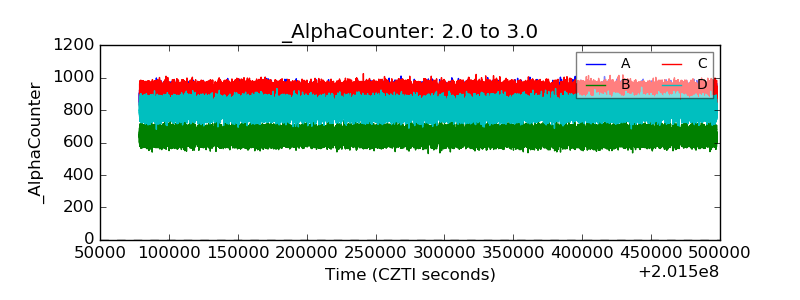 |
| _CPM_Rate |  |
| CZT Counter |  |
| +2.5 Volts monitor |  |
| +5 Volts monitor |  |
| _ROLL_ROT |  |
| _Roll_DEC |  |
| _Roll_RA |  |
| Veto Counter |  |