| Param | Original file | Final file |
|---|---|---|
| Filename | modeM0/AS1G05_192T01_9000000466cztM0_level2.evt | modeM0/AS1G05_192T01_9000000466cztM0_level2_quad_clean.evt |
| Size (bytes) | 3,098,180,160 | 592,862,400 |
| Size | 2.9 GB | 565.4 MB |
| Events in quadrant A | 23,410,353 | 3,731,439 |
| Events in quadrant B | 24,287,794 | 3,765,803 |
| Events in quadrant C | 22,790,040 | 3,747,924 |
| Events in quadrant D | 20,312,621 | 3,633,183 |
| Mode M0 | |||
|---|---|---|---|
| Quadrant | BADHDUFLAG | Total packets | Discarded packets |
| A | 0 | 100388 | 0 |
| B | 0 | 102754 | 0 |
| C | 0 | 99292 | 0 |
| D | 0 | 94284 | 0 |
| Mode SS | |||
|---|---|---|---|
| Quadrant | BADHDUFLAG | Total packets | Discarded packets |
| A | 0 | 910 | 0 |
| B | 0 | 910 | 0 |
| C | 0 | 910 | 0 |
| D | 0 | 910 | 0 |
| Mode M9 | |||
|---|---|---|---|
| Quadrant | BADHDUFLAG | Total packets | Discarded packets |
| A | 0 | 72 | 0 |
| B | 0 | 72 | 0 |
| C | 0 | 72 | 0 |
| D | 0 | 72 | 0 |
| Quadrant | Total seconds | Saturated seconds | Saturation percentage |
|---|---|---|---|
| A | 44863 | 829 | 1.847848% |
| B | 44863 | 652 | 1.453313% |
| C | 44863 | 718 | 1.600428% |
| D | 44863 | 476 | 1.061008% |
Noise dominated data is calculated using 1-second bins in cleaned event files. If a bin has >2000 counts, and if more than 50% of those come from <1% of pixels, then it is considered to be noise-dominated and hence unusable.
| Quadrant | # 1 sec bins | Bins with >0 counts | Bins with >2000 counts | High rate bins dominated by noise | Noise dominated (total time) | Noise dominated (detector-on time) | Marked lightcurve |
|---|---|---|---|---|---|---|---|
| A | 53736 | 44867 | 273 | 273 | 0.51% | 0.61% |  |
| B | 53736 | 44867 | 60 | 60 | 0.11% | 0.13% |  |
| C | 53736 | 44866 | 303 | 303 | 0.56% | 0.68% | 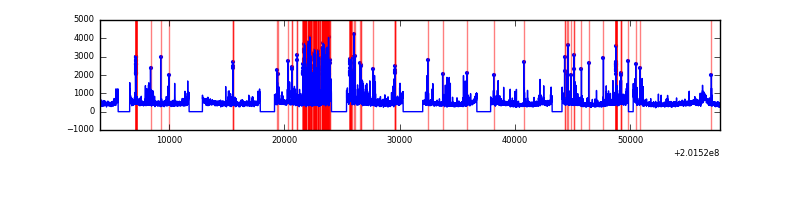 |
| D | 53736 | 44867 | 114 | 114 | 0.21% | 0.25% | 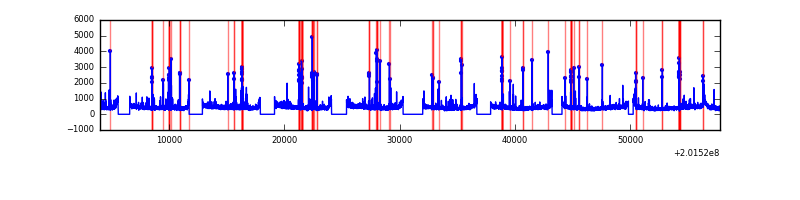 |
Top three noisy pixels from each quadrant. If the there are fewer than three noisy pixels in the level2.evt file, extra rows are filled as -1
| Pixel properties | Quadrant properties | ||||||
|---|---|---|---|---|---|---|---|
| Quadrant | DetID | PixID | Counts | Sigma | Mean | Median | Sigma |
| A | 0 | 50 | 1626521 | 1533.19 | 5261 | 5168 | 1057.5 |
| A | 8 | 15 | 827228 | 777.36 | 5261 | 5168 | 1057.5 |
| A | 14 | 238 | 443537 | 414.53 | 5261 | 5168 | 1057.5 |
| B | 15 | 204 | 2328127 | 2271.13 | 5353 | 5236 | 1022.8 |
| B | 4 | 81 | 599163 | 580.69 | 5353 | 5236 | 1022.8 |
| B | 4 | 200 | 195107 | 185.64 | 5353 | 5236 | 1022.8 |
| C | 7 | 220 | 992851 | 834.53 | 5152 | 5182 | 1183.5 |
| C | 1 | 192 | 897773 | 754.2 | 5152 | 5182 | 1183.5 |
| C | 15 | 208 | 279588 | 231.86 | 5152 | 5182 | 1183.5 |
| D | 13 | 223 | 384129 | 307.78 | 5132 | 4994 | 1231.8 |
| D | 13 | 239 | 169367 | 133.44 | 5132 | 4994 | 1231.8 |
| D | 5 | 233 | 125397 | 97.74 | 5132 | 4994 | 1231.8 |
Histogram calculated using DETX and DETY for each event in the final _common_clean file
| Quadrant A | 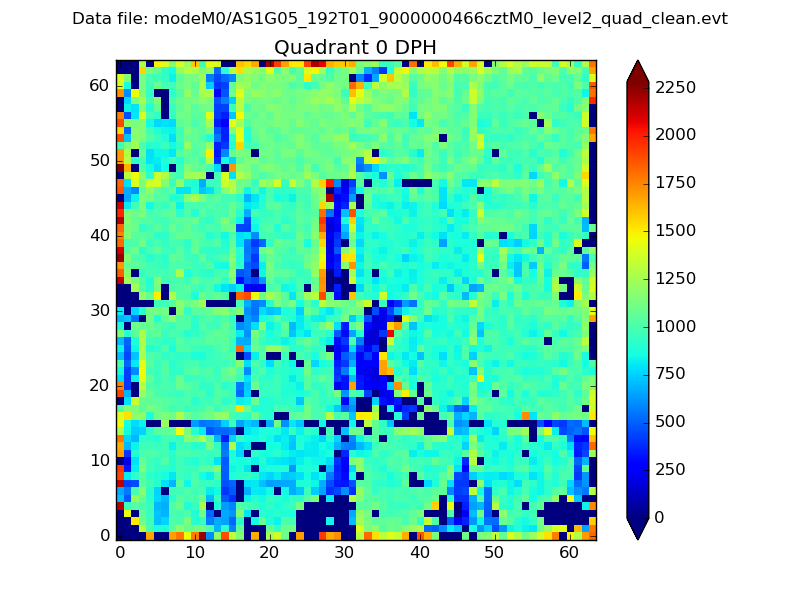 |
 |
Quadrant B |
|---|---|---|---|
| Quadrant D |  |
 |
Quadrant C |
| Plot type | Count rate plots | Images |
|---|---|---|
| Comparison with Poisson distribution Blue bars denote a histogram of data divided into 1 sec bins. Red curve is a Poisson curve with rate = median count rate of data. |
 |
 |
| Quadrant-wise count rates Data is divided into 100 sec bins |
 |
|
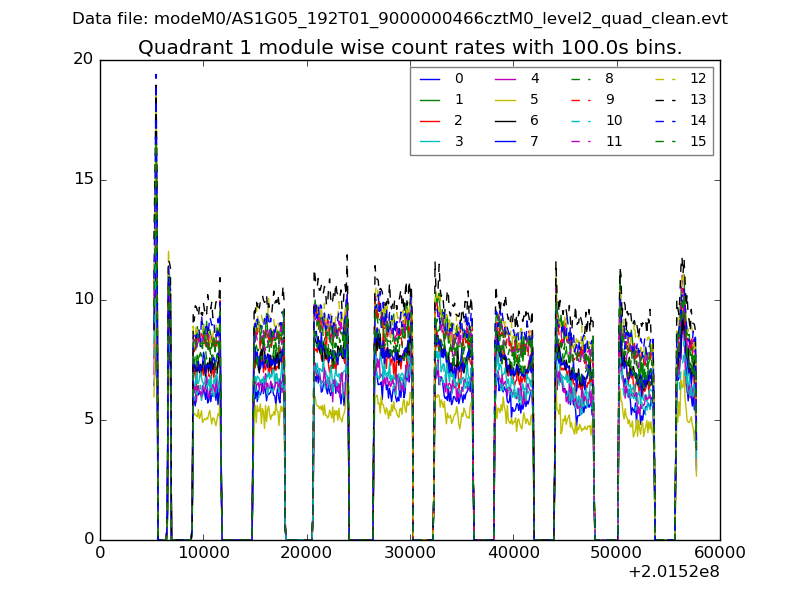
| Module-wise count rates for Quadrant A Data is divided into 100 sec bins |
 |
 |
| Module-wise count rates for Quadrant B Data is divided into 100 sec bins |
 |
 |
| Module-wise count rates for Quadrant C Data is divided into 100 sec bins |
 |
 |
| Module-wise count rates for Quadrant D Data is divided into 100 sec bins |
 |
 |
| Parameter | Plot |
|---|---|
| CZT HV Monitor |  |
| D_VDD |  |
| Temperature 1 |  |
| Veto HV Monitor |  |
| Veto LLD |  |
| Alpha Counter |  |
| _CPM_Rate |  |
| CZT Counter |  |
| +2.5 Volts monitor |  |
| +5 Volts monitor |  |
| _ROLL_ROT |  |
| _Roll_DEC |  |
| _Roll_RA | 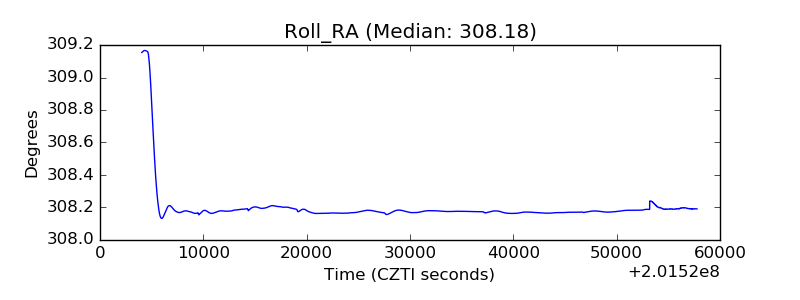 |
| Veto Counter |  |