| Param | Original file | Final file |
|---|---|---|
| Filename | modeM0/AS1G05_245T01_9000000460cztM0_level2.evt | modeM0/AS1G05_245T01_9000000460cztM0_level2_quad_clean.evt |
| Size (bytes) | 9,235,428,480 | 1,546,148,160 |
| Size | 8.6 GB | 1.4 GB |
| Events in quadrant A | 69,152,010 | 9,507,284 |
| Events in quadrant B | 69,301,064 | 9,687,798 |
| Events in quadrant C | 74,704,850 | 9,513,069 |
| Events in quadrant D | 58,007,505 | 9,451,630 |
| Mode M0 | |||
|---|---|---|---|
| Quadrant | BADHDUFLAG | Total packets | Discarded packets |
| A | 0 | 294260 | 0 |
| B | 0 | 289786 | 0 |
| C | 0 | 311012 | 0 |
| D | 0 | 268842 | 0 |
| Mode M9 | |||
|---|---|---|---|
| Quadrant | BADHDUFLAG | Total packets | Discarded packets |
| A | 0 | 189 | 0 |
| B | 0 | 189 | 0 |
| C | 0 | 189 | 0 |
| D | 0 | 189 | 0 |
| Mode SS | |||
|---|---|---|---|
| Quadrant | BADHDUFLAG | Total packets | Discarded packets |
| A | 0 | 2572 | 0 |
| B | 0 | 2572 | 0 |
| C | 0 | 2572 | 0 |
| D | 0 | 2572 | 0 |
| Quadrant | Total seconds | Saturated seconds | Saturation percentage |
|---|---|---|---|
| A | 126508 | 3936 | 3.111266% |
| B | 126508 | 2565 | 2.027540% |
| C | 126508 | 5893 | 4.658203% |
| D | 126508 | 1880 | 1.486072% |
Noise dominated data is calculated using 1-second bins in cleaned event files. If a bin has >2000 counts, and if more than 50% of those come from <1% of pixels, then it is considered to be noise-dominated and hence unusable.
| Quadrant | # 1 sec bins | Bins with >0 counts | Bins with >2000 counts | High rate bins dominated by noise | Noise dominated (total time) | Noise dominated (detector-on time) | Marked lightcurve |
|---|---|---|---|---|---|---|---|
| A | 151558 | 126525 | 1402 | 1402 | 0.93% | 1.11% |  |
| B | 151558 | 126524 | 511 | 511 | 0.34% | 0.40% |  |
| C | 151559 | 126525 | 4025 | 4025 | 2.66% | 3.18% | 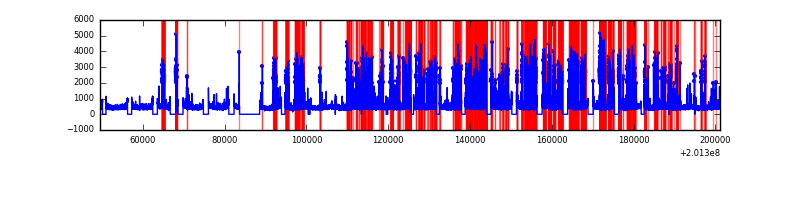 |
| D | 151559 | 126525 | 689 | 689 | 0.45% | 0.54% | 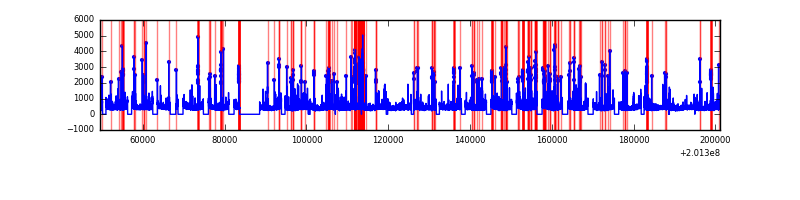 |
Top three noisy pixels from each quadrant. If the there are fewer than three noisy pixels in the level2.evt file, extra rows are filled as -1
| Pixel properties | Quadrant properties | ||||||
|---|---|---|---|---|---|---|---|
| Quadrant | DetID | PixID | Counts | Sigma | Mean | Median | Sigma |
| A | 0 | 50 | 6918495 | 2330.3 | 14533 | 14240 | 2962.8 |
| A | 0 | 118 | 3930223 | 1321.71 | 14533 | 14240 | 2962.8 |
| A | 14 | 111 | 583103 | 192.0 | 14533 | 14240 | 2962.8 |
| B | 15 | 204 | 6563757 | 2298.6 | 14798 | 14447 | 2849.3 |
| B | 4 | 81 | 1378060 | 478.58 | 14798 | 14447 | 2849.3 |
| B | 2 | 249 | 893831 | 308.64 | 14798 | 14447 | 2849.3 |
| C | 7 | 220 | 17227552 | 5297.87 | 14059 | 14151 | 3249.1 |
| C | 1 | 192 | 1389235 | 423.22 | 14059 | 14151 | 3249.1 |
| C | 1 | 16 | 446083 | 132.94 | 14059 | 14151 | 3249.1 |
| D | 13 | 46 | 1533638 | 447.85 | 14202 | 13822 | 3393.6 |
| D | 13 | 239 | 631394 | 181.98 | 14202 | 13822 | 3393.6 |
| D | 13 | 223 | 612127 | 176.31 | 14202 | 13822 | 3393.6 |
Histogram calculated using DETX and DETY for each event in the final _common_clean file
| Quadrant A |  |
 |
Quadrant B |
|---|---|---|---|
| Quadrant D |  |
 |
Quadrant C |
| Plot type | Count rate plots | Images |
|---|---|---|
| Comparison with Poisson distribution Blue bars denote a histogram of data divided into 1 sec bins. Red curve is a Poisson curve with rate = median count rate of data. |
 |
 |
| Quadrant-wise count rates Data is divided into 100 sec bins |
 |
|
| Module-wise count rates for Quadrant A Data is divided into 100 sec bins |
 |
 |
| Module-wise count rates for Quadrant B Data is divided into 100 sec bins |
 |
 |
| Module-wise count rates for Quadrant C Data is divided into 100 sec bins |
 |
 |
| Module-wise count rates for Quadrant D Data is divided into 100 sec bins |
 |
 |
| Parameter | Plot |
|---|---|
| CZT HV Monitor | 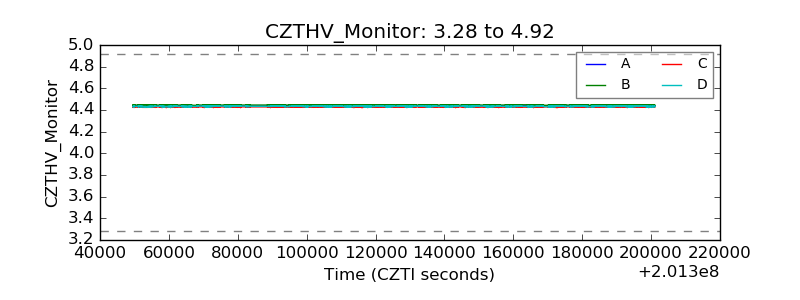 |
| D_VDD | 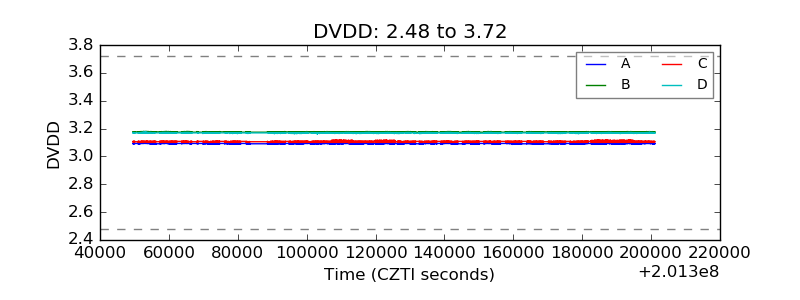 |
| Temperature 1 |  |
| Veto HV Monitor |  |
| Veto LLD | 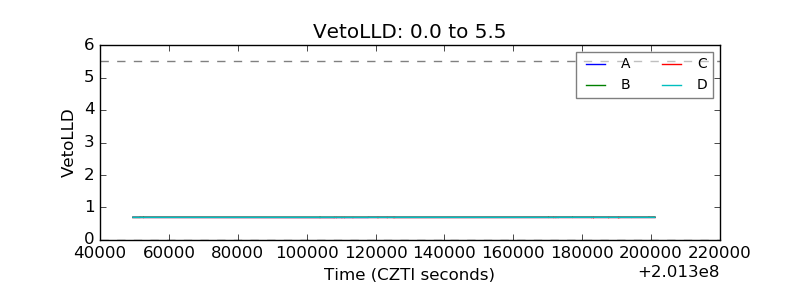 |
| Alpha Counter |  |
| _CPM_Rate | 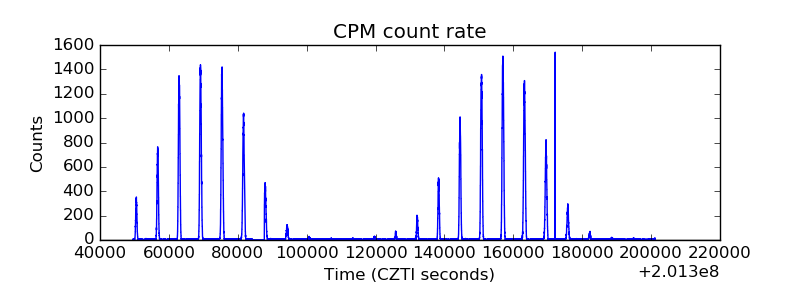 |
| CZT Counter |  |
| +2.5 Volts monitor |  |
| +5 Volts monitor |  |
| _ROLL_ROT |  |
| _Roll_DEC |  |
| _Roll_RA |  |
| Veto Counter |  |