| Param | Original file | Final file |
|---|---|---|
| Filename | modeM0/AS1G05_211T01_9000000464cztM0_level2_bc.evt | modeM0/AS1G05_211T01_9000000464cztM0_level2_quad_clean.evt |
| Size (bytes) | 3,915,299,520 | 1,159,689,600 |
| Size | 3.6 GB | 1.1 GB |
| Events in quadrant A | 26,953,525 | 7,068,809 |
| Events in quadrant B | 27,405,756 | 7,110,448 |
| Events in quadrant C | 35,560,001 | 6,882,433 |
| Events in quadrant D | 21,473,742 | 6,835,886 |
| Mode M0 | |||
|---|---|---|---|
| Quadrant | BADHDUFLAG | Total packets | Discarded packets |
| A | 0 | 242937 | 0 |
| B | 0 | 237202 | 0 |
| C | 0 | 273019 | 0 |
| D | 0 | 224460 | 0 |
| Mode SS | |||
|---|---|---|---|
| Quadrant | BADHDUFLAG | Total packets | Discarded packets |
| A | 0 | 2142 | 0 |
| B | 0 | 2142 | 0 |
| C | 0 | 2142 | 0 |
| D | 0 | 2142 | 0 |
| Mode M9 | |||
|---|---|---|---|
| Quadrant | BADHDUFLAG | Total packets | Discarded packets |
| A | 0 | 124 | 0 |
| B | 0 | 124 | 0 |
| C | 0 | 124 | 0 |
| D | 0 | 125 | 0 |
| Quadrant | Total seconds | Saturated seconds | Saturation percentage |
|---|---|---|---|
| A | 105416 | 3193 | 3.028952% |
| B | 105416 | 2121 | 2.012029% |
| C | 105416 | 5965 | 5.658534% |
| D | 105415 | 1690 | 1.603187% |
Noise dominated data is calculated using 1-second bins in cleaned event files. If a bin has >2000 counts, and if more than 50% of those come from <1% of pixels, then it is considered to be noise-dominated and hence unusable.
| Quadrant | # 1 sec bins | Bins with >0 counts | Bins with >2000 counts | High rate bins dominated by noise | Noise dominated (total time) | Noise dominated (detector-on time) | Marked lightcurve |
|---|---|---|---|---|---|---|---|
| A | 126713 | 105417 | 118 | 118 | 0.09% | 0.11% |  |
| B | 126713 | 105412 | 37 | 37 | 0.03% | 0.04% |  |
| C | 126713 | 105409 | 1094 | 1094 | 0.86% | 1.04% |  |
| D | 126713 | 105411 | 51 | 51 | 0.04% | 0.05% | 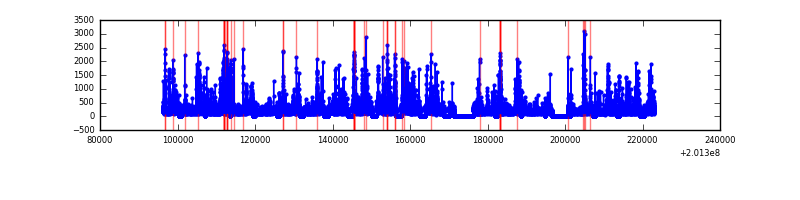 |
Top three noisy pixels from each quadrant. If the there are fewer than three noisy pixels in the level2.evt file, extra rows are filled as -1
| Pixel properties | Quadrant properties | ||||||
|---|---|---|---|---|---|---|---|
| Quadrant | DetID | PixID | Counts | Sigma | Mean | Median | Sigma |
| A | 0 | 50 | 5598744 | 5148.91 | 4877 | 4756 | 1086.4 |
| A | 0 | 118 | 1470121 | 1348.78 | 4877 | 4756 | 1086.4 |
| A | 8 | 15 | 337670 | 306.43 | 4877 | 4756 | 1086.4 |
| B | 15 | 204 | 4644764 | 4841.98 | 4957 | 4804 | 958.3 |
| B | 8 | 3 | 740230 | 767.45 | 4957 | 4804 | 958.3 |
| B | 15 | 85 | 554775 | 573.92 | 4957 | 4804 | 958.3 |
| C | 7 | 220 | 10425499 | 9802.31 | 4753 | 4664 | 1063.1 |
| C | 1 | 192 | 5399559 | 5074.68 | 4753 | 4664 | 1063.1 |
| C | 1 | 16 | 351097 | 325.87 | 4753 | 4664 | 1063.1 |
| D | 13 | 46 | 771747 | 677.53 | 4874 | 4686 | 1132.1 |
| D | 13 | 239 | 387639 | 338.26 | 4874 | 4686 | 1132.1 |
| D | 13 | 223 | 386047 | 336.85 | 4874 | 4686 | 1132.1 |
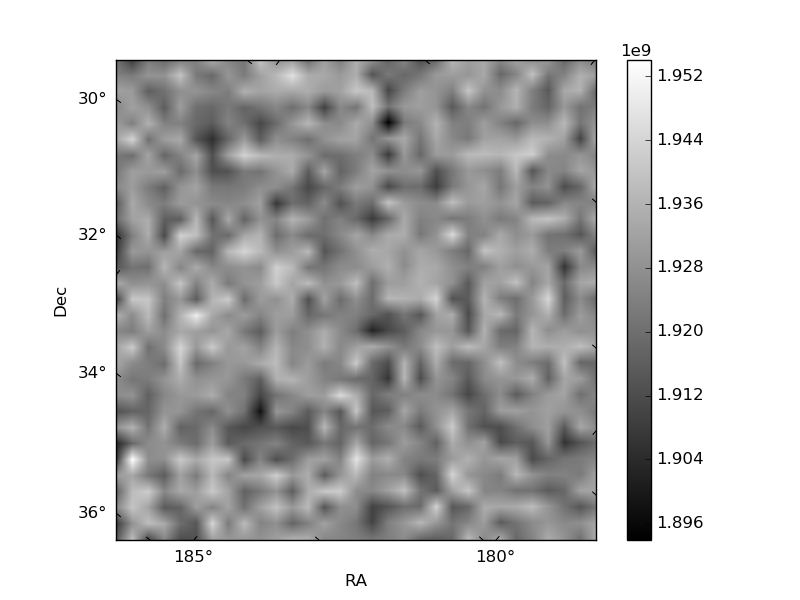
Histogram calculated using DETX and DETY for each event in the final _common_clean file
| Quadrant A | 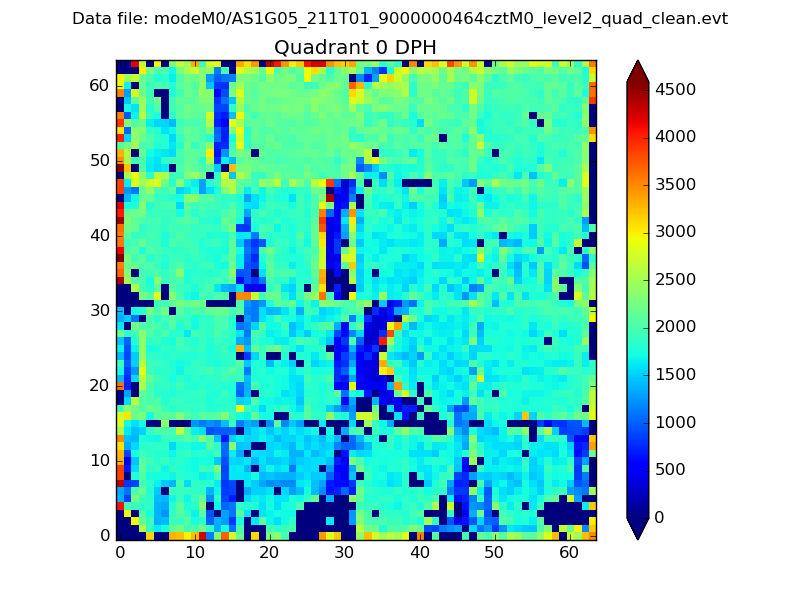 |
 |
Quadrant B |
|---|---|---|---|
| Quadrant D |  |
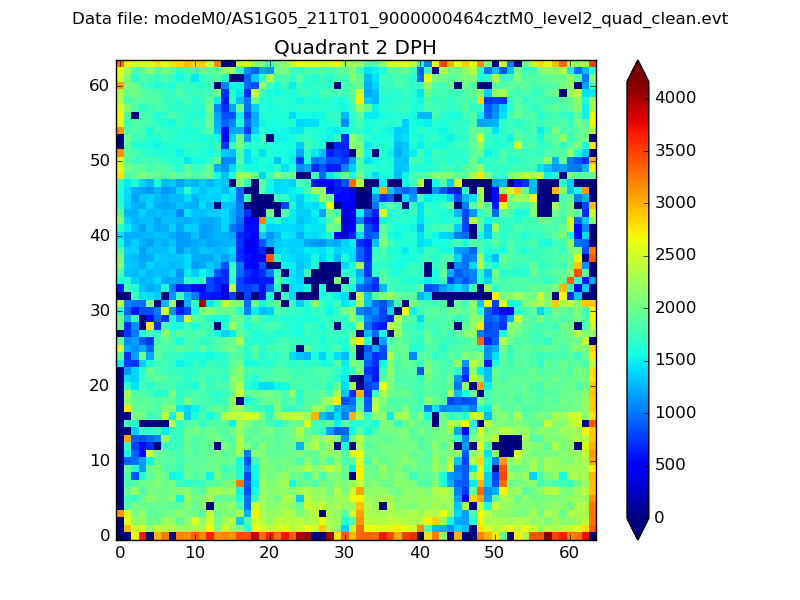 |
Quadrant C |
| Plot type | Count rate plots | Images |
|---|---|---|
| Comparison with Poisson distribution Blue bars denote a histogram of data divided into 1 sec bins. Red curve is a Poisson curve with rate = median count rate of data. |
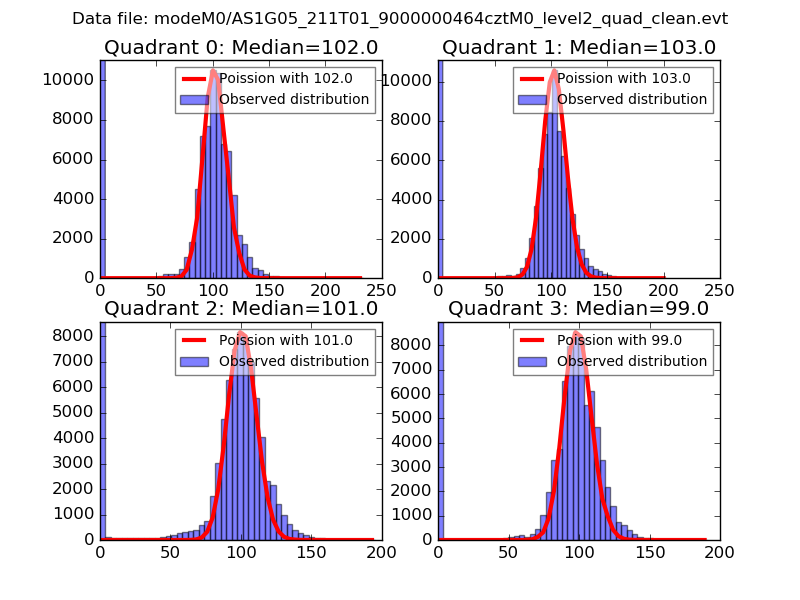 |
 |
| Quadrant-wise count rates Data is divided into 100 sec bins |
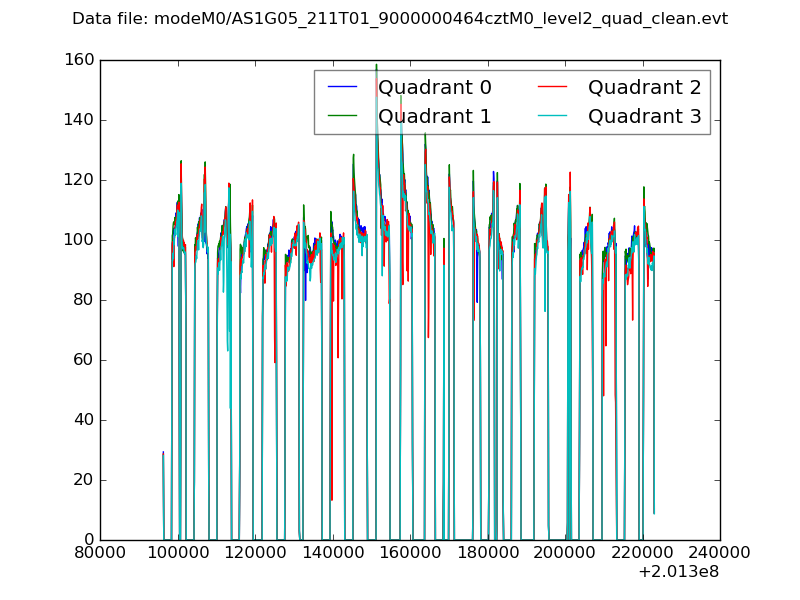 |
|
| Module-wise count rates for Quadrant A Data is divided into 100 sec bins |
 |
 |
| Module-wise count rates for Quadrant B Data is divided into 100 sec bins |
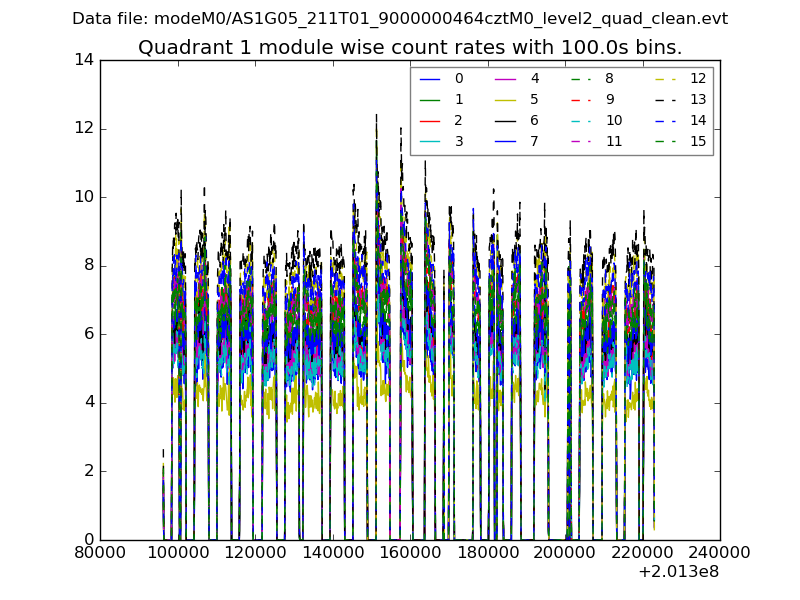 |
 |
| Module-wise count rates for Quadrant C Data is divided into 100 sec bins |
 |
 |
| Module-wise count rates for Quadrant D Data is divided into 100 sec bins |
 |
 |
| Parameter | Plot |
|---|---|
| CZT HV Monitor | 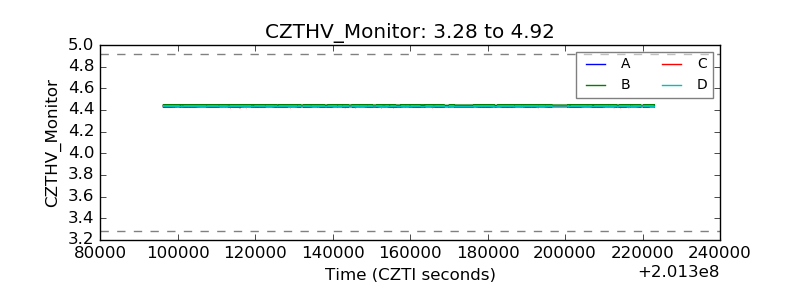 |
| D_VDD |  |
| Temperature 1 | 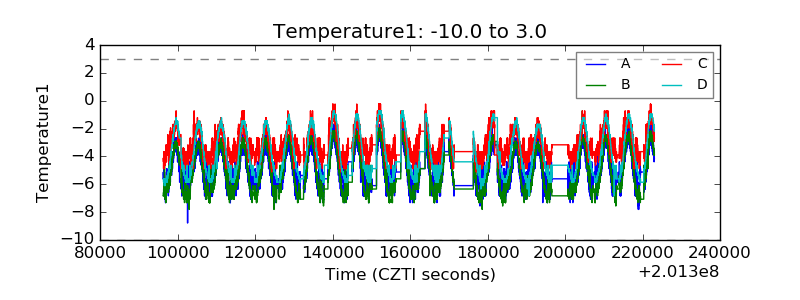 |
| Veto HV Monitor |  |
| Veto LLD |  |
| Alpha Counter |  |
| _CPM_Rate |  |
| CZT Counter |  |
| +2.5 Volts monitor |  |
| +5 Volts monitor |  |
| _ROLL_ROT | 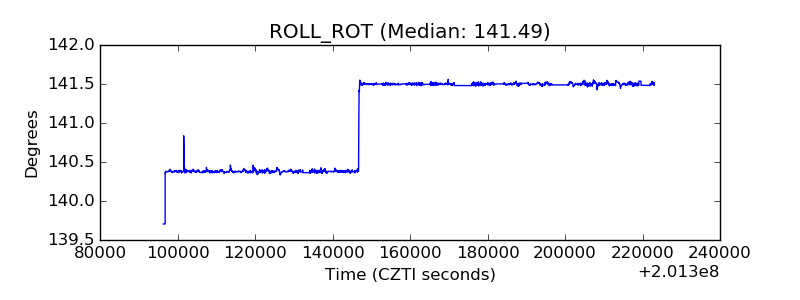 |
| _Roll_DEC | 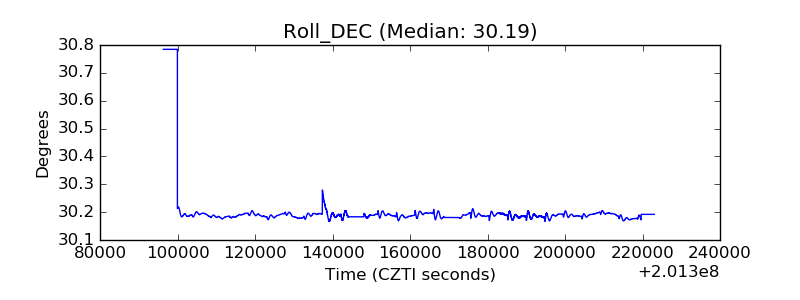 |
| _Roll_RA |  |
| Veto Counter | 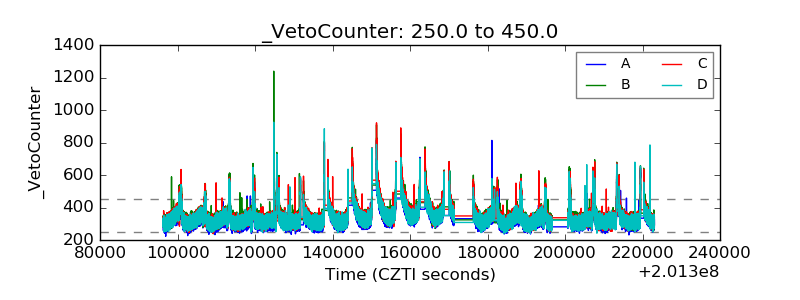 |