| Param | Original file | Final file |
|---|---|---|
| Filename | modeM0/AS1G05_083T03_9000000462cztM0_level2_bc.evt | modeM0/AS1G05_083T03_9000000462cztM0_level2_quad_clean.evt |
| Size (bytes) | 661,849,920 | 230,728,320 |
| Size | 631.2 MB | 220.0 MB |
| Events in quadrant A | 5,834,718 | 1,400,685 |
| Events in quadrant B | 4,731,385 | 1,445,638 |
| Events in quadrant C | 4,333,716 | 1,472,510 |
| Events in quadrant D | 3,901,887 | 1,419,252 |
| Mode M9 | |||
|---|---|---|---|
| Quadrant | BADHDUFLAG | Total packets | Discarded packets |
| A | 0 | 50 | 0 |
| B | 0 | 50 | 0 |
| C | 0 | 50 | 0 |
| D | 0 | 50 | 0 |
| Mode SS | |||
|---|---|---|---|
| Quadrant | BADHDUFLAG | Total packets | Discarded packets |
| A | 0 | 370 | 0 |
| B | 0 | 370 | 0 |
| C | 0 | 370 | 0 |
| D | 0 | 370 | 0 |
| Mode M0 | |||
|---|---|---|---|
| Quadrant | BADHDUFLAG | Total packets | Discarded packets |
| A | 0 | 45963 | 0 |
| B | 0 | 40784 | 0 |
| C | 0 | 39999 | 0 |
| D | 0 | 38310 | 0 |
| Quadrant | Total seconds | Saturated seconds | Saturation percentage |
|---|---|---|---|
| A | 18141 | 770 | 4.244529% |
| B | 18141 | 276 | 1.521416% |
| C | 18141 | 397 | 2.188413% |
| D | 18141 | 231 | 1.273359% |
Noise dominated data is calculated using 1-second bins in cleaned event files. If a bin has >2000 counts, and if more than 50% of those come from <1% of pixels, then it is considered to be noise-dominated and hence unusable.
| Quadrant | # 1 sec bins | Bins with >0 counts | Bins with >2000 counts | High rate bins dominated by noise | Noise dominated (total time) | Noise dominated (detector-on time) | Marked lightcurve |
|---|---|---|---|---|---|---|---|
| A | 27724 | 18141 | 18 | 18 | 0.06% | 0.10% |  |
| B | 27724 | 18140 | 5 | 5 | 0.02% | 0.03% | 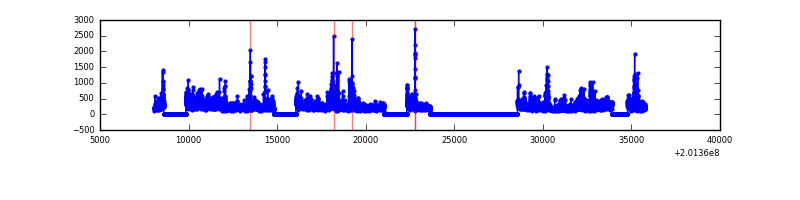 |
| C | 27724 | 18140 | 15 | 15 | 0.05% | 0.08% |  |
| D | 27724 | 18142 | 24 | 24 | 0.09% | 0.13% |  |
Top three noisy pixels from each quadrant. If the there are fewer than three noisy pixels in the level2.evt file, extra rows are filled as -1
| Pixel properties | Quadrant properties | ||||||
|---|---|---|---|---|---|---|---|
| Quadrant | DetID | PixID | Counts | Sigma | Mean | Median | Sigma |
| A | 0 | 118 | 1367167 | 6839.81 | 907 | 887 | 199.8 |
| A | 0 | 50 | 515135 | 2574.41 | 907 | 887 | 199.8 |
| A | 15 | 234 | 203937 | 1016.5 | 907 | 887 | 199.8 |
| B | 15 | 204 | 697612 | 3898.2 | 936 | 909 | 178.7 |
| B | 2 | 249 | 218206 | 1215.82 | 936 | 909 | 178.7 |
| B | 4 | 200 | 71305 | 393.88 | 936 | 909 | 178.7 |
| C | 7 | 220 | 452211 | 2190.1 | 932 | 919 | 206.1 |
| C | 1 | 192 | 138461 | 667.49 | 932 | 919 | 206.1 |
| C | 12 | 4 | 29478 | 138.6 | 932 | 919 | 206.1 |
| D | 2 | 107 | 62418 | 289.68 | 931 | 899 | 212.4 |
| D | 13 | 46 | 61664 | 286.13 | 931 | 899 | 212.4 |
| D | 13 | 223 | 43342 | 199.86 | 931 | 899 | 212.4 |
Histogram calculated using DETX and DETY for each event in the final _common_clean file
| Quadrant A |  |
 |
Quadrant B |
|---|---|---|---|
| Quadrant D | 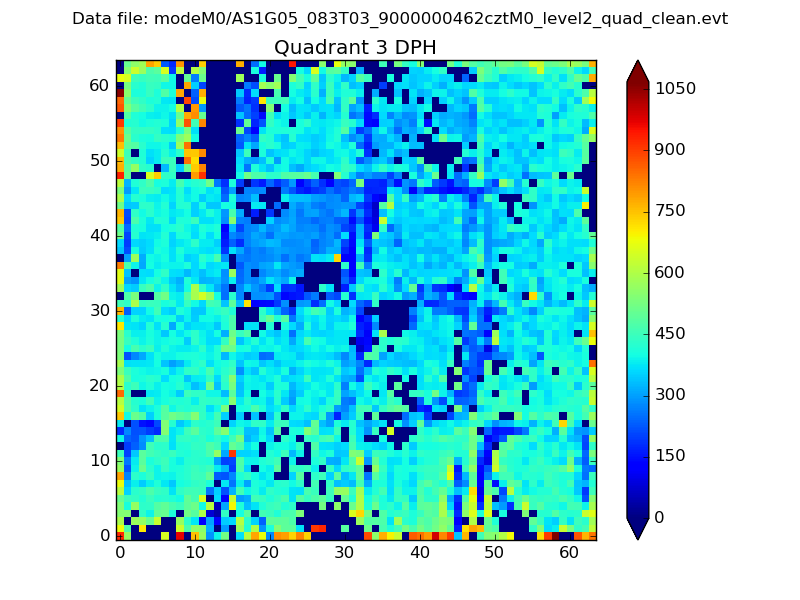 |
 |
Quadrant C |
| Plot type | Count rate plots | Images |
|---|---|---|
| Comparison with Poisson distribution Blue bars denote a histogram of data divided into 1 sec bins. Red curve is a Poisson curve with rate = median count rate of data. |
 |
 |
| Quadrant-wise count rates Data is divided into 100 sec bins |
 |
|
| Module-wise count rates for Quadrant A Data is divided into 100 sec bins |
 |
 |
| Module-wise count rates for Quadrant B Data is divided into 100 sec bins |
 |
 |
| Module-wise count rates for Quadrant C Data is divided into 100 sec bins |
 |
 |
| Module-wise count rates for Quadrant D Data is divided into 100 sec bins |
 |
 |
| Parameter | Plot |
|---|---|
| CZT HV Monitor |  |
| D_VDD | 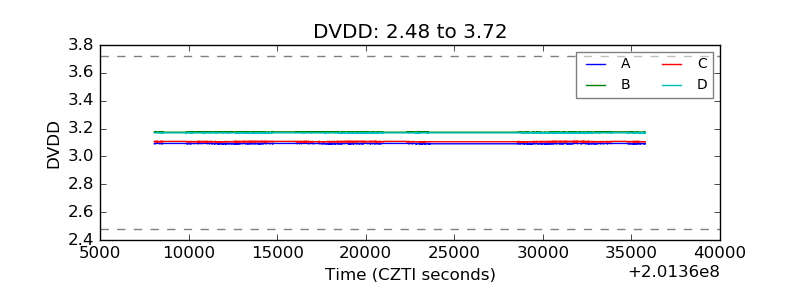 |
| Temperature 1 |  |
| Veto HV Monitor |  |
| Veto LLD |  |
| Alpha Counter | 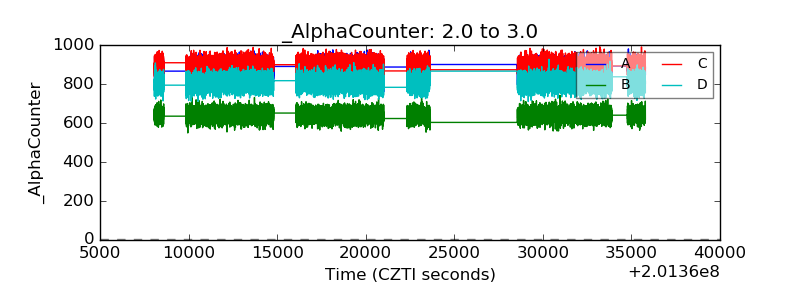 |
| _CPM_Rate |  |
| CZT Counter |  |
| +2.5 Volts monitor |  |
| +5 Volts monitor |  |
| _ROLL_ROT |  |
| _Roll_DEC |  |
| _Roll_RA |  |
| Veto Counter | 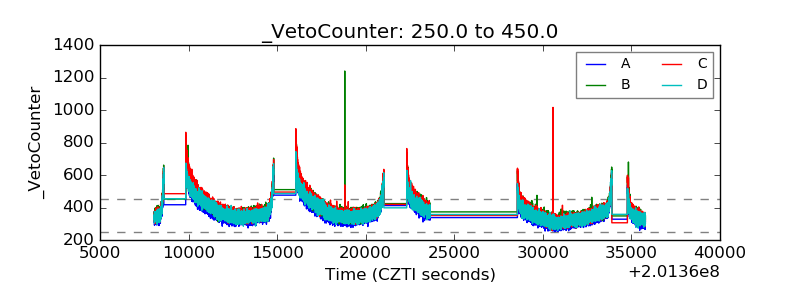 |