| Param | Original file | Final file |
|---|---|---|
| Filename | modeM0/AS1G05_209T01_9000000458cztM0_level2.evt | modeM0/AS1G05_209T01_9000000458cztM0_level2_quad_clean.evt |
| Size (bytes) | 3,494,479,680 | 869,699,520 |
| Size | 3.3 GB | 829.4 MB |
| Events in quadrant A | 25,576,768 | 5,676,134 |
| Events in quadrant B | 27,822,660 | 5,760,735 |
| Events in quadrant C | 26,206,577 | 5,788,890 |
| Events in quadrant D | 22,757,703 | 5,595,439 |
| Mode M0 | |||
|---|---|---|---|
| Quadrant | BADHDUFLAG | Total packets | Discarded packets |
| A | 0 | 113916 | 0 |
| B | 0 | 118162 | 0 |
| C | 0 | 116396 | 0 |
| D | 0 | 107802 | 0 |
| Mode SS | |||
|---|---|---|---|
| Quadrant | BADHDUFLAG | Total packets | Discarded packets |
| A | 0 | 1044 | 0 |
| B | 0 | 1044 | 0 |
| C | 0 | 1044 | 0 |
| D | 0 | 1044 | 0 |
| Mode M9 | |||
|---|---|---|---|
| Quadrant | BADHDUFLAG | Total packets | Discarded packets |
| A | 0 | 60 | 0 |
| B | 0 | 60 | 0 |
| C | 0 | 60 | 0 |
| D | 0 | 60 | 0 |
| Quadrant | Total seconds | Saturated seconds | Saturation percentage |
|---|---|---|---|
| A | 51356 | 1211 | 2.358050% |
| B | 51357 | 738 | 1.437000% |
| C | 51357 | 1273 | 2.478727% |
| D | 51357 | 421 | 0.819752% |
Noise dominated data is calculated using 1-second bins in cleaned event files. If a bin has >2000 counts, and if more than 50% of those come from <1% of pixels, then it is considered to be noise-dominated and hence unusable.
| Quadrant | # 1 sec bins | Bins with >0 counts | Bins with >2000 counts | High rate bins dominated by noise | Noise dominated (total time) | Noise dominated (detector-on time) | Marked lightcurve |
|---|---|---|---|---|---|---|---|
| A | 57227 | 51367 | 458 | 458 | 0.80% | 0.89% |  |
| B | 57227 | 51370 | 172 | 172 | 0.30% | 0.33% |  |
| C | 57227 | 51369 | 973 | 973 | 1.70% | 1.89% |  |
| D | 57227 | 51369 | 147 | 147 | 0.26% | 0.29% |  |
Top three noisy pixels from each quadrant. If the there are fewer than three noisy pixels in the level2.evt file, extra rows are filled as -1
| Pixel properties | Quadrant properties | ||||||
|---|---|---|---|---|---|---|---|
| Quadrant | DetID | PixID | Counts | Sigma | Mean | Median | Sigma |
| A | 8 | 15 | 1609285 | 1402.22 | 5622 | 5485 | 1143.8 |
| A | 0 | 118 | 913342 | 793.75 | 5622 | 5485 | 1143.8 |
| A | 14 | 249 | 579335 | 501.72 | 5622 | 5485 | 1143.8 |
| B | 15 | 204 | 3600956 | 3331.23 | 5734 | 5589 | 1079.3 |
| B | 0 | 219 | 291245 | 264.67 | 5734 | 5589 | 1079.3 |
| B | 14 | 167 | 255829 | 231.86 | 5734 | 5589 | 1079.3 |
| C | 1 | 192 | 3330044 | 2617.92 | 5515 | 5534 | 1269.9 |
| C | 10 | 19 | 350877 | 271.94 | 5515 | 5534 | 1269.9 |
| C | 6 | 80 | 257690 | 198.56 | 5515 | 5534 | 1269.9 |
| D | 13 | 223 | 425355 | 320.63 | 5505 | 5340 | 1310.0 |
| D | 5 | 233 | 351396 | 264.17 | 5505 | 5340 | 1310.0 |
| D | 2 | 37 | 308304 | 231.28 | 5505 | 5340 | 1310.0 |
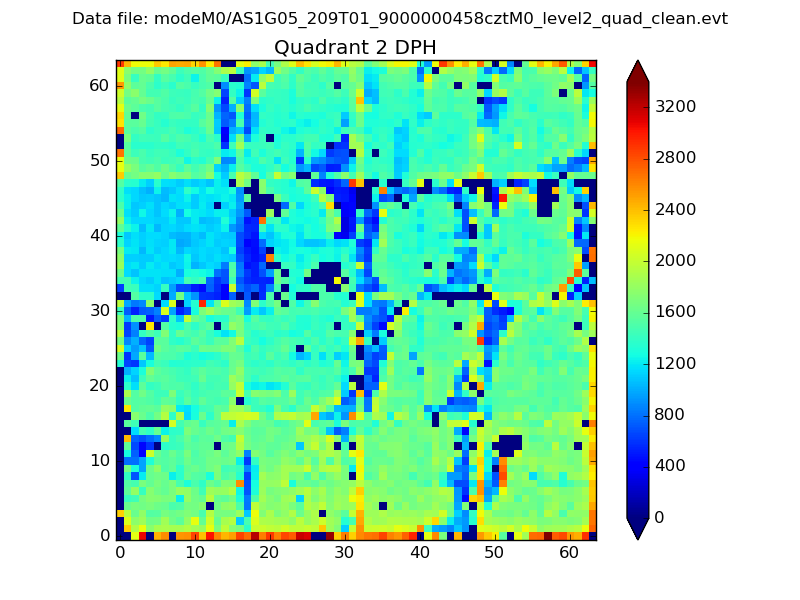
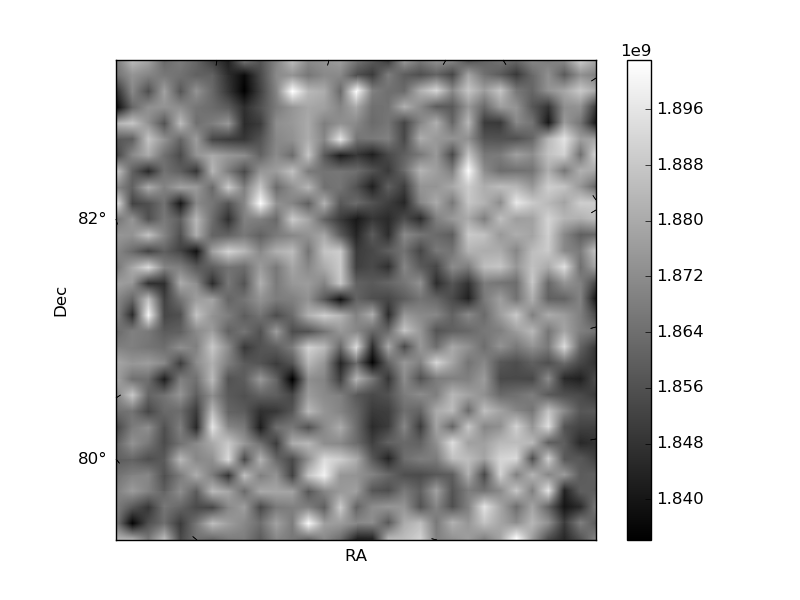
Histogram calculated using DETX and DETY for each event in the final _common_clean file
| Quadrant A |  |
 |
Quadrant B |
|---|---|---|---|
| Quadrant D | 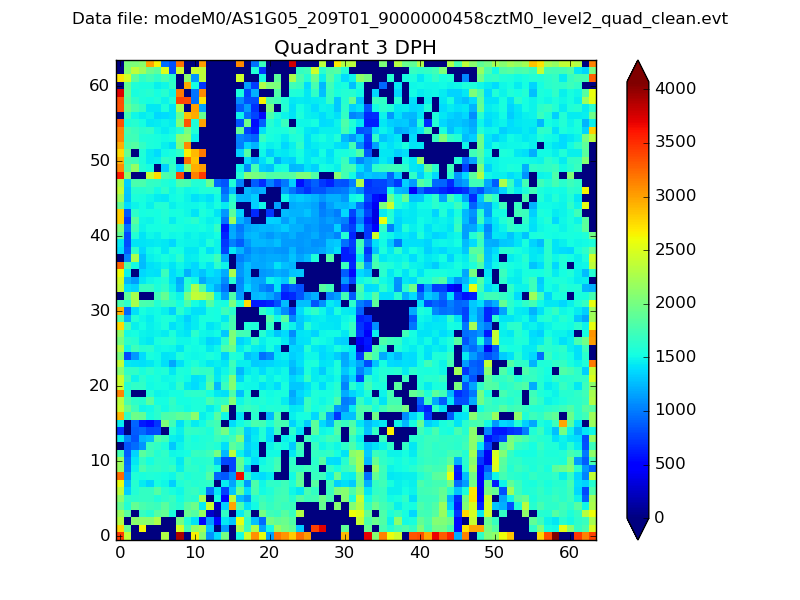 |
 |
Quadrant C |
| Plot type | Count rate plots | Images |
|---|---|---|
| Comparison with Poisson distribution Blue bars denote a histogram of data divided into 1 sec bins. Red curve is a Poisson curve with rate = median count rate of data. |
 |
 |
| Quadrant-wise count rates Data is divided into 100 sec bins |
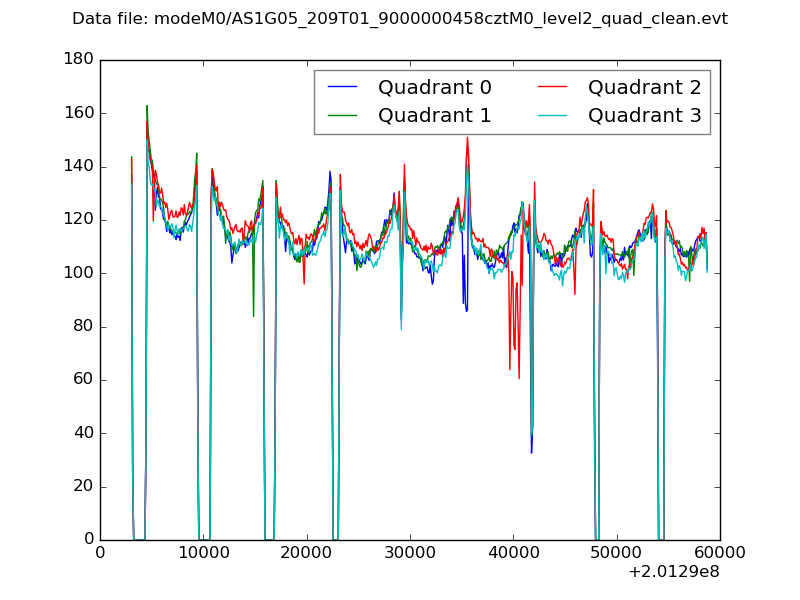 |
|
| Module-wise count rates for Quadrant A Data is divided into 100 sec bins |
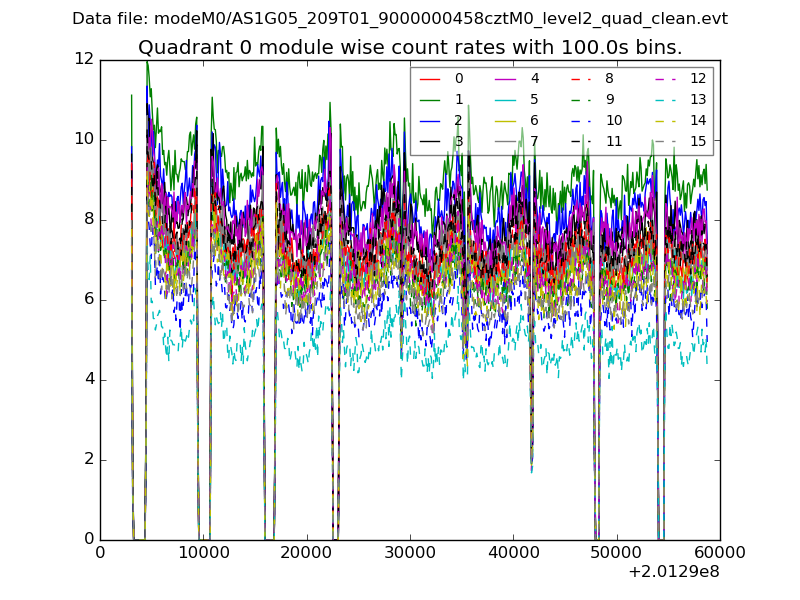 |
 |
| Module-wise count rates for Quadrant B Data is divided into 100 sec bins |
 |
 |
| Module-wise count rates for Quadrant C Data is divided into 100 sec bins |
 |
 |
| Module-wise count rates for Quadrant D Data is divided into 100 sec bins |
 |
 |
| Parameter | Plot |
|---|---|
| CZT HV Monitor |  |
| D_VDD |  |
| Temperature 1 |  |
| Veto HV Monitor |  |
| Veto LLD |  |
| Alpha Counter |  |
| _CPM_Rate |  |
| CZT Counter |  |
| +2.5 Volts monitor |  |
| +5 Volts monitor |  |
| _ROLL_ROT |  |
| _Roll_DEC | 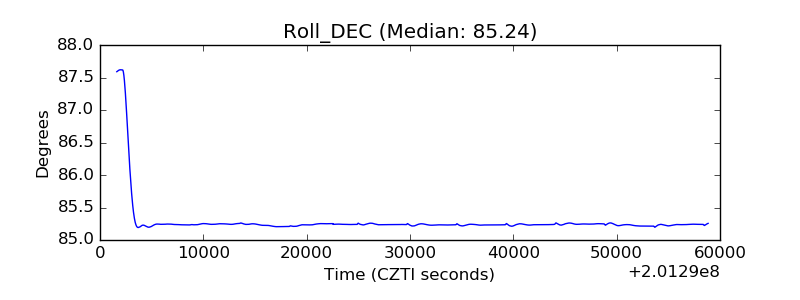 |
| _Roll_RA | 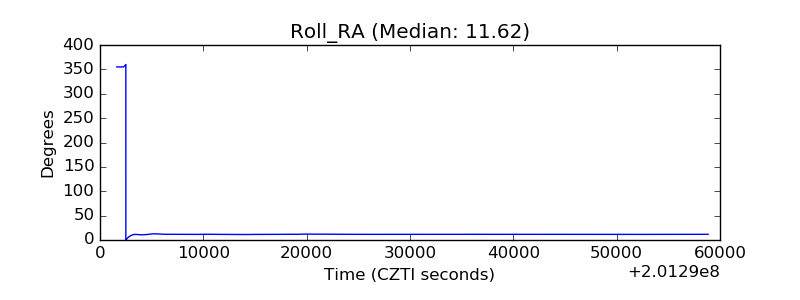 |
| Veto Counter | 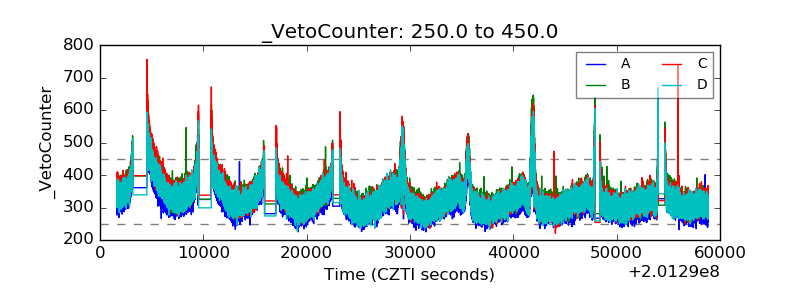 |