| Param | Original file | Final file |
|---|---|---|
| Filename | modeM0/AS1G05_167T01_9000000456cztM0_level2.evt | modeM0/AS1G05_167T01_9000000456cztM0_level2_quad_clean.evt |
| Size (bytes) | 15,825,801,600 | 2,917,105,920 |
| Size | 14.7 GB | 2.7 GB |
| Events in quadrant A | 105,704,703 | 18,613,126 |
| Events in quadrant B | 117,758,273 | 18,787,381 |
| Events in quadrant C | 139,608,223 | 18,196,122 |
| Events in quadrant D | 101,649,410 | 17,960,341 |
| Mode M0 | |||
|---|---|---|---|
| Quadrant | BADHDUFLAG | Total packets | Discarded packets |
| A | 0 | 460529 | 0 |
| B | 0 | 490284 | 0 |
| C | 0 | 562464 | 0 |
| D | 0 | 459848 | 0 |
| Mode M9 | |||
|---|---|---|---|
| Quadrant | BADHDUFLAG | Total packets | Discarded packets |
| A | 0 | 302 | 0 |
| B | 0 | 302 | 0 |
| C | 0 | 302 | 0 |
| D | 0 | 302 | 0 |
| Mode SS | |||
|---|---|---|---|
| Quadrant | BADHDUFLAG | Total packets | Discarded packets |
| A | 0 | 4388 | 0 |
| B | 0 | 4388 | 0 |
| C | 0 | 4388 | 0 |
| D | 0 | 4388 | 0 |
| Quadrant | Total seconds | Saturated seconds | Saturation percentage |
|---|---|---|---|
| A | 216111 | 2893 | 1.338664% |
| B | 216111 | 3391 | 1.569101% |
| C | 216111 | 13315 | 6.161186% |
| D | 216111 | 2641 | 1.222057% |
Noise dominated data is calculated using 1-second bins in cleaned event files. If a bin has >2000 counts, and if more than 50% of those come from <1% of pixels, then it is considered to be noise-dominated and hence unusable.
| Quadrant | # 1 sec bins | Bins with >0 counts | Bins with >2000 counts | High rate bins dominated by noise | Noise dominated (total time) | Noise dominated (detector-on time) | Marked lightcurve |
|---|---|---|---|---|---|---|---|
| A | 246213 | 216148 | 383 | 383 | 0.16% | 0.18% |  |
| B | 246213 | 216151 | 452 | 452 | 0.18% | 0.21% |  |
| C | 246213 | 216151 | 9419 | 9419 | 3.83% | 4.36% |  |
| D | 246213 | 216149 | 916 | 916 | 0.37% | 0.42% |  |
Top three noisy pixels from each quadrant. If the there are fewer than three noisy pixels in the level2.evt file, extra rows are filled as -1
| Pixel properties | Quadrant properties | ||||||
|---|---|---|---|---|---|---|---|
| Quadrant | DetID | PixID | Counts | Sigma | Mean | Median | Sigma |
| A | 0 | 50 | 1850763 | 352.48 | 25647 | 25136 | 5179.3 |
| A | 14 | 249 | 1694718 | 322.36 | 25647 | 25136 | 5179.3 |
| A | 8 | 15 | 1393525 | 264.2 | 25647 | 25136 | 5179.3 |
| B | 15 | 204 | 10720069 | 2138.21 | 26027 | 25427 | 5001.7 |
| B | 14 | 167 | 2448686 | 484.49 | 26027 | 25427 | 5001.7 |
| B | 2 | 249 | 1420162 | 278.85 | 26027 | 25427 | 5001.7 |
| C | 7 | 220 | 20268256 | 3582.79 | 24488 | 24741 | 5650.2 |
| C | 1 | 192 | 16272365 | 2875.58 | 24488 | 24741 | 5650.2 |
| C | 15 | 208 | 3272895 | 574.87 | 24488 | 24741 | 5650.2 |
| D | 13 | 223 | 3130430 | 518.21 | 24892 | 24200 | 5994.2 |
| D | 9 | 85 | 1258837 | 205.97 | 24892 | 24200 | 5994.2 |
| D | 2 | 37 | 888465 | 144.18 | 24892 | 24200 | 5994.2 |
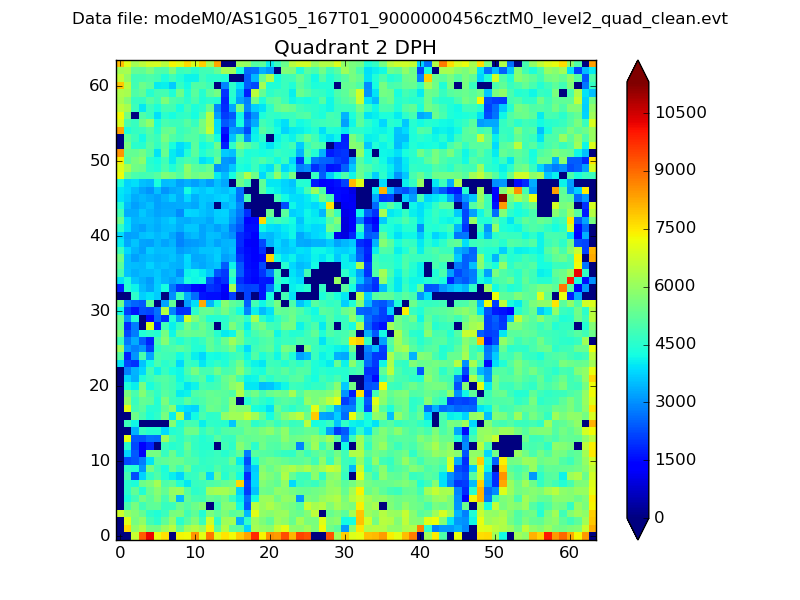
Histogram calculated using DETX and DETY for each event in the final _common_clean file
| Quadrant A |  |
 |
Quadrant B |
|---|---|---|---|
| Quadrant D | 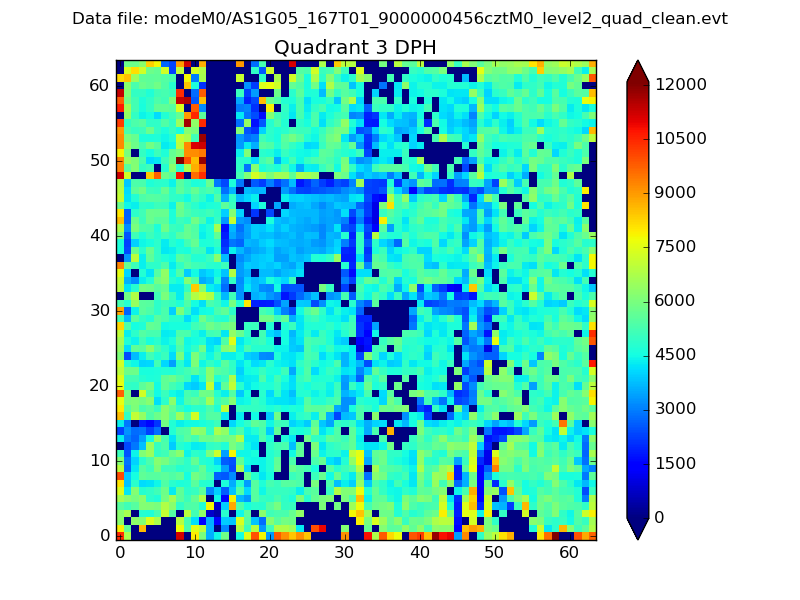 |
 |
Quadrant C |
| Plot type | Count rate plots | Images |
|---|---|---|
| Comparison with Poisson distribution Blue bars denote a histogram of data divided into 1 sec bins. Red curve is a Poisson curve with rate = median count rate of data. |
 |
 |
| Quadrant-wise count rates Data is divided into 100 sec bins |
 |
|
| Module-wise count rates for Quadrant A Data is divided into 100 sec bins |
 |
 |
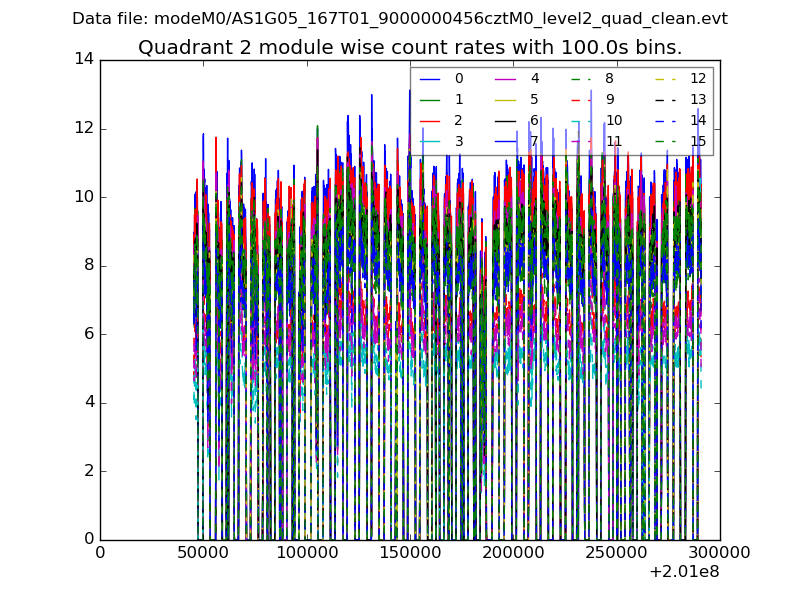
| Module-wise count rates for Quadrant B Data is divided into 100 sec bins |
 |
 |
| Module-wise count rates for Quadrant C Data is divided into 100 sec bins |
 |
 |
| Module-wise count rates for Quadrant D Data is divided into 100 sec bins |
 |
 |
| Parameter | Plot |
|---|---|
| CZT HV Monitor | 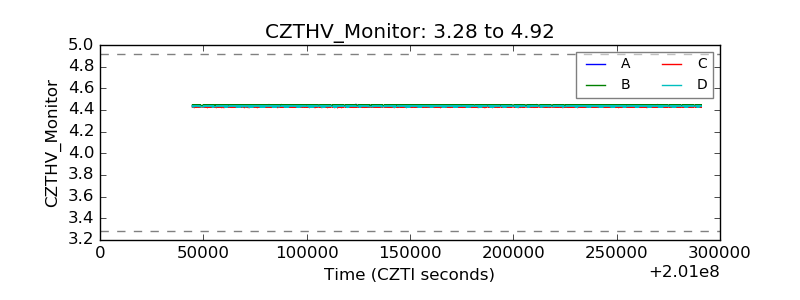 |
| D_VDD |  |
| Temperature 1 | 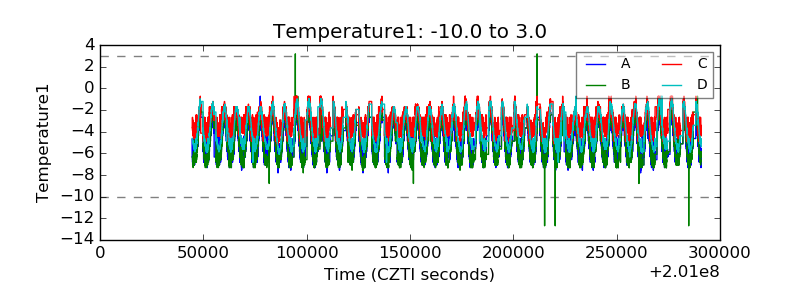 |
| Veto HV Monitor |  |
| Veto LLD |  |
| Alpha Counter |  |
| _CPM_Rate |  |
| CZT Counter |  |
| +2.5 Volts monitor | 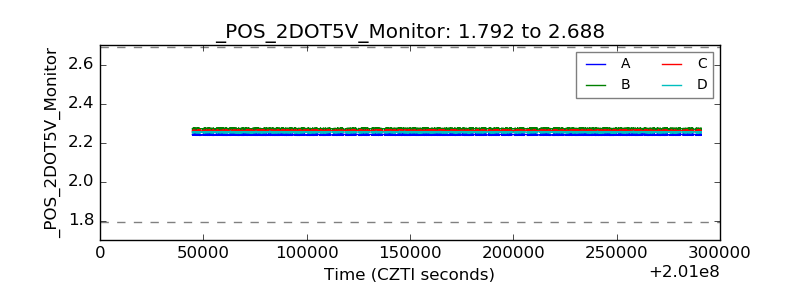 |
| +5 Volts monitor |  |
| _ROLL_ROT |  |
| _Roll_DEC |  |
| _Roll_RA |  |
| Veto Counter |  |