| Param | Original file | Final file |
|---|---|---|
| Filename | modeM0/AS1G05_210T01_9000000454cztM0_level2_bc.evt | modeM0/AS1G05_210T01_9000000454cztM0_level2_quad_clean.evt |
| Size (bytes) | 3,339,768,960 | 1,076,538,240 |
| Size | 3.1 GB | 1.0 GB |
| Events in quadrant A | 19,681,712 | 6,516,294 |
| Events in quadrant B | 27,020,302 | 6,510,665 |
| Events in quadrant C | 27,583,075 | 6,416,310 |
| Events in quadrant D | 20,028,114 | 6,292,110 |
| Mode SS | |||
|---|---|---|---|
| Quadrant | BADHDUFLAG | Total packets | Discarded packets |
| A | 0 | 2036 | 0 |
| B | 0 | 2036 | 0 |
| C | 0 | 2036 | 0 |
| D | 0 | 2036 | 0 |
| Mode M0 | |||
|---|---|---|---|
| Quadrant | BADHDUFLAG | Total packets | Discarded packets |
| A | 0 | 208626 | 0 |
| B | 0 | 229459 | 0 |
| C | 0 | 237114 | 0 |
| D | 0 | 209445 | 0 |
| Mode M9 | |||
|---|---|---|---|
| Quadrant | BADHDUFLAG | Total packets | Discarded packets |
| A | 0 | 169 | 0 |
| B | 0 | 169 | 0 |
| C | 0 | 169 | 0 |
| D | 0 | 169 | 0 |
| Quadrant | Total seconds | Saturated seconds | Saturation percentage |
|---|---|---|---|
| A | 100275 | 1527 | 1.522812% |
| B | 100275 | 1879 | 1.873847% |
| C | 100275 | 3193 | 3.184243% |
| D | 100275 | 1156 | 1.152830% |
Noise dominated data is calculated using 1-second bins in cleaned event files. If a bin has >2000 counts, and if more than 50% of those come from <1% of pixels, then it is considered to be noise-dominated and hence unusable.
| Quadrant | # 1 sec bins | Bins with >0 counts | Bins with >2000 counts | High rate bins dominated by noise | Noise dominated (total time) | Noise dominated (detector-on time) | Marked lightcurve |
|---|---|---|---|---|---|---|---|
| A | 116680 | 100282 | 10 | 10 | 0.01% | 0.01% |  |
| B | 116680 | 100280 | 45 | 45 | 0.04% | 0.04% |  |
| C | 116680 | 100281 | 267 | 267 | 0.23% | 0.27% |  |
| D | 116680 | 100279 | 42 | 42 | 0.04% | 0.04% |  |
Top three noisy pixels from each quadrant. If the there are fewer than three noisy pixels in the level2.evt file, extra rows are filled as -1
| Pixel properties | Quadrant properties | ||||||
|---|---|---|---|---|---|---|---|
| Quadrant | DetID | PixID | Counts | Sigma | Mean | Median | Sigma |
| A | 0 | 118 | 520402 | 486.19 | 4744 | 4626 | 1060.9 |
| A | 8 | 15 | 406386 | 378.71 | 4744 | 4626 | 1060.9 |
| A | 0 | 31 | 155500 | 142.22 | 4744 | 4626 | 1060.9 |
| B | 15 | 204 | 5929471 | 6478.48 | 4799 | 4651 | 914.5 |
| B | 14 | 167 | 1306433 | 1423.43 | 4799 | 4651 | 914.5 |
| B | 2 | 249 | 386088 | 417.08 | 4799 | 4651 | 914.5 |
| C | 7 | 220 | 5160615 | 4945.9 | 4657 | 4562 | 1042.5 |
| C | 14 | 223 | 1254644 | 1199.13 | 4657 | 4562 | 1042.5 |
| C | 1 | 192 | 938012 | 895.4 | 4657 | 4562 | 1042.5 |
| D | 2 | 37 | 480470 | 432.26 | 4705 | 4518 | 1101.1 |
| D | 12 | 246 | 206527 | 183.47 | 4705 | 4518 | 1101.1 |
| D | 13 | 239 | 192786 | 170.99 | 4705 | 4518 | 1101.1 |
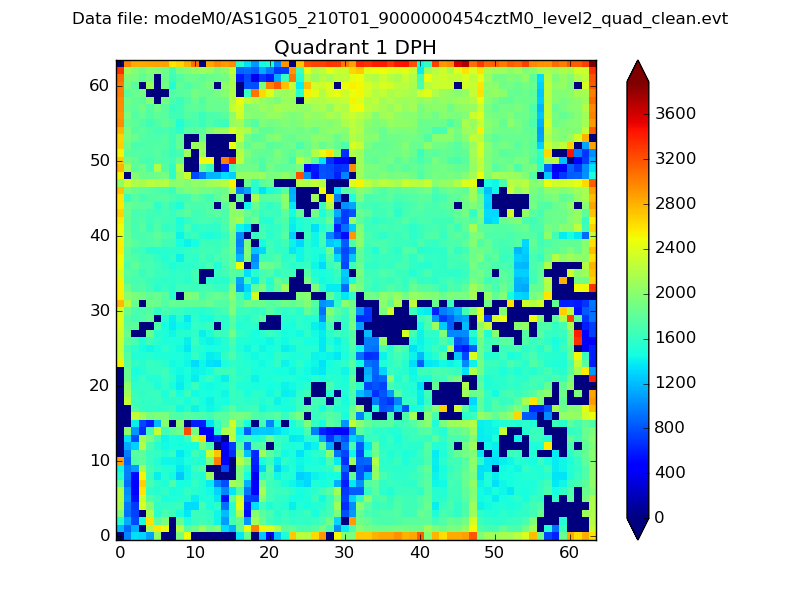
Histogram calculated using DETX and DETY for each event in the final _common_clean file
| Quadrant A |  |
 |
Quadrant B |
|---|---|---|---|
| Quadrant D |  |
 |
Quadrant C |
| Plot type | Count rate plots | Images |
|---|---|---|
| Comparison with Poisson distribution Blue bars denote a histogram of data divided into 1 sec bins. Red curve is a Poisson curve with rate = median count rate of data. |
 |
 |
| Quadrant-wise count rates Data is divided into 100 sec bins |
 |
|
| Module-wise count rates for Quadrant A Data is divided into 100 sec bins |
 |
 |
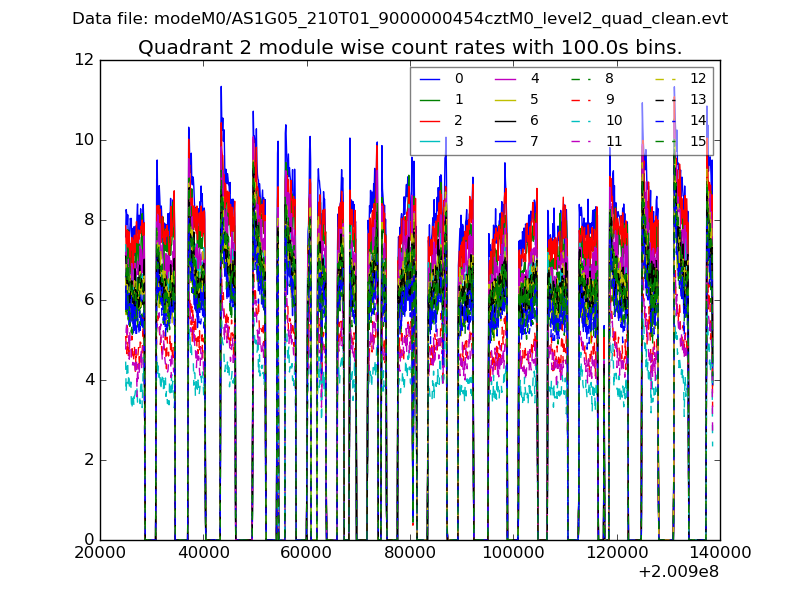
| Module-wise count rates for Quadrant B Data is divided into 100 sec bins |
 |
 |
| Module-wise count rates for Quadrant C Data is divided into 100 sec bins |
 |
 |
| Module-wise count rates for Quadrant D Data is divided into 100 sec bins |
 |
 |
| Parameter | Plot |
|---|---|
| CZT HV Monitor | 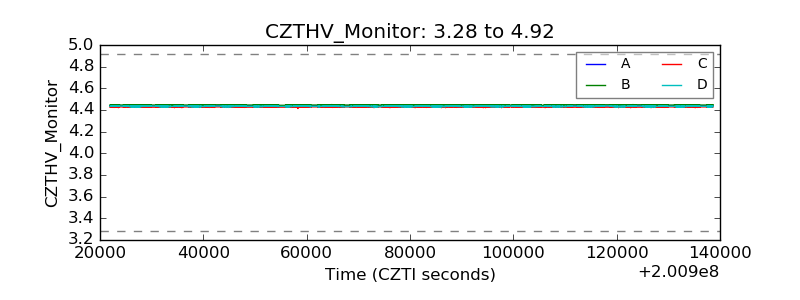 |
| D_VDD | 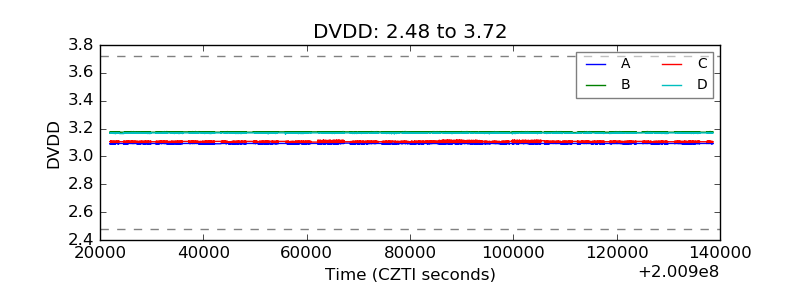 |
| Temperature 1 |  |
| Veto HV Monitor |  |
| Veto LLD | 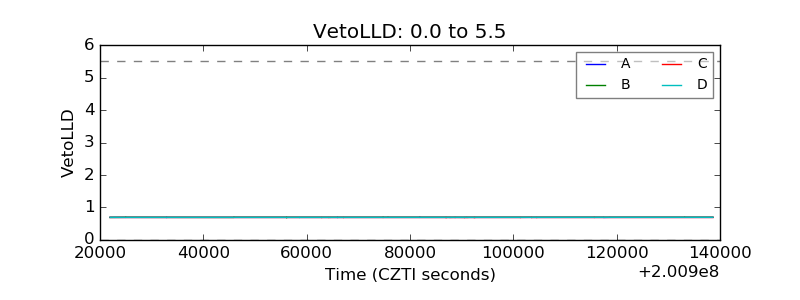 |
| Alpha Counter |  |
| _CPM_Rate |  |
| CZT Counter |  |
| +2.5 Volts monitor | 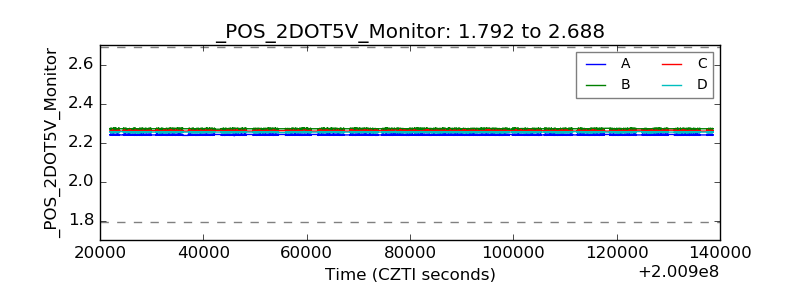 |
| +5 Volts monitor |  |
| _ROLL_ROT |  |
| _Roll_DEC |  |
| _Roll_RA |  |
| Veto Counter |  |